

HOT TOPICS LIST
- MACD
- Fibonacci
- RSI
- Gann
- ADXR
- Stochastics
- Volume
- Triangles
- Futures
- Cycles
- Volatility
- ZIGZAG
- MESA
- Retracement
- Aroon
INDICATORS LIST
LIST OF TOPICS
PRINT THIS ARTICLE
by Koos van der Merwe
Analyzing the share market, looking for buy signals can be a tough job.
Position: Buy
Koos van der Merwe
Has been a technical analyst since 1969, and has worked as a futures and options trader with First Financial Futures in Johannesburg, South Africa.
PRINT THIS ARTICLE
TECHNICAL ANALYSIS
Looking For Buys
10/19/17 05:07:53 PMby Koos van der Merwe
Analyzing the share market, looking for buy signals can be a tough job.
Position: Buy
| There are many programs out there that will allow you to analyze all the shares available, whether American, Canadian, European, it simply depends on which stocks you load into your database. However, finding the best program to give you the most successful analysis can be expensive. In 1993 I found a program I liked because it allowed me to play with it and change and change and change the strategies I use to analyze the market. Has it been successful over the years? Quite honestly, I don't know, because I am continuously changing the strategies I use, looking for something better. At the moment, in the chart in Figure 1, I am using 3 strategies which I believe are very good. I have yet to test them over a few months. Last month, September, the first month I tested the strategy, my profit on daily charts was 4.24%, and on weekly charts was 4.96%. Not bad, but being greedy, I want greater than 100% return per year, so it is test and retest. On Friday, October 6, the program suggested I look at the share below. |
|
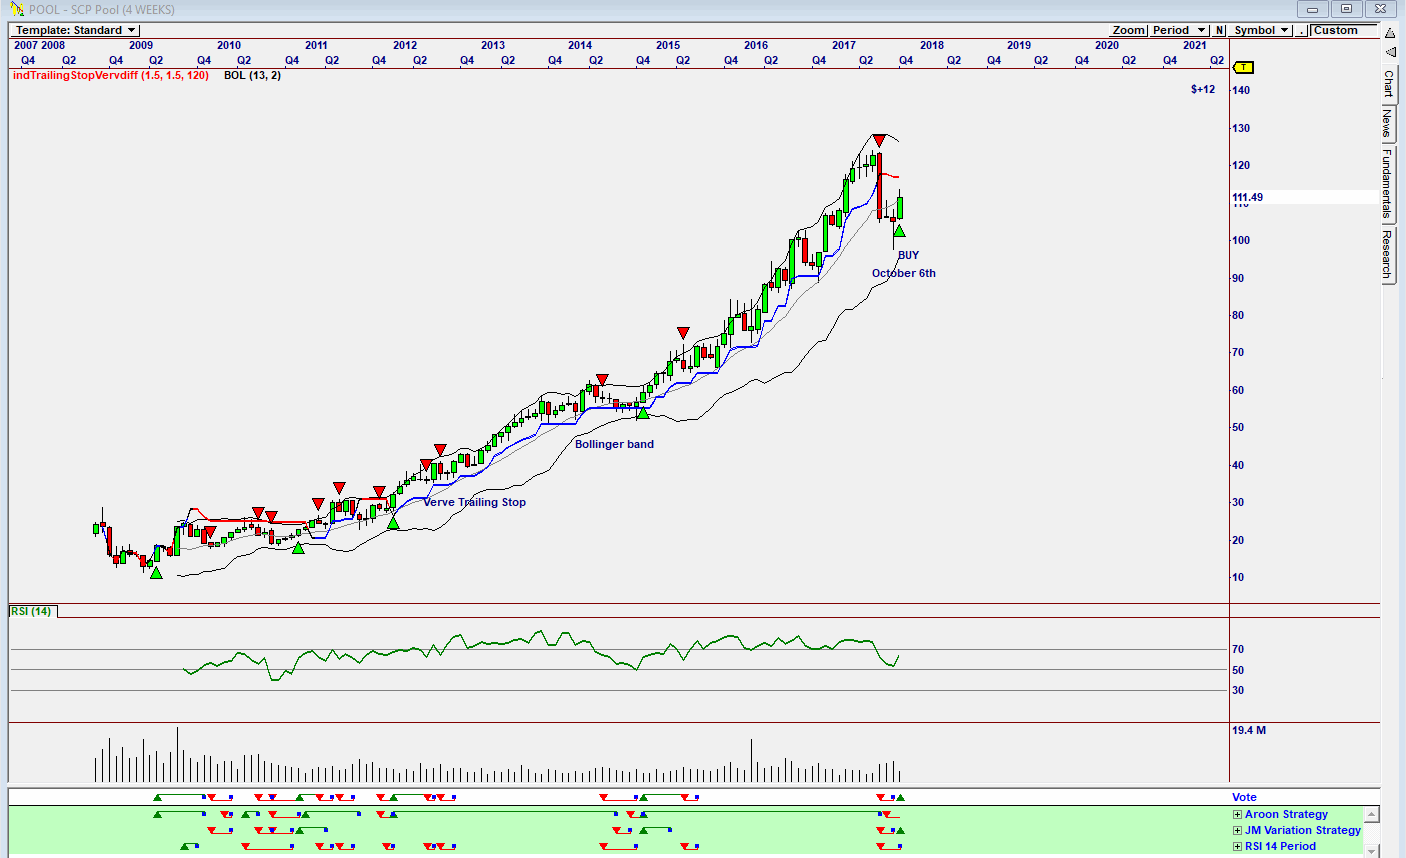
| Figure 1. 4-Week chart showing a buy. |
| Graphic provided by: Omnitrader. |
| |
| The chart in Figure 1 is an Omnitrader 4 weekly chart which suggested a buy for the week ending October 7. The share is SCP Pool Corporation, whose share price closed at $111.49 on Friday, October 6. The company is uniquely positioned to provide marketing and sales support to swimming pool supplies, equipment and related leisure products. The chart shows that a buy signal has been given on the week ending October 6th based on the JM Variation Strategy shown in green below the Vote line. The RSI Indicator, however, is trending down, suggesting weakness, but the RSI 14-period strategy shown in green closed out a sell signal on the week ending October 6. The Aroon strategy is still in sell mode. Volume has fallen as the price rose, suggesting weakness. |
|
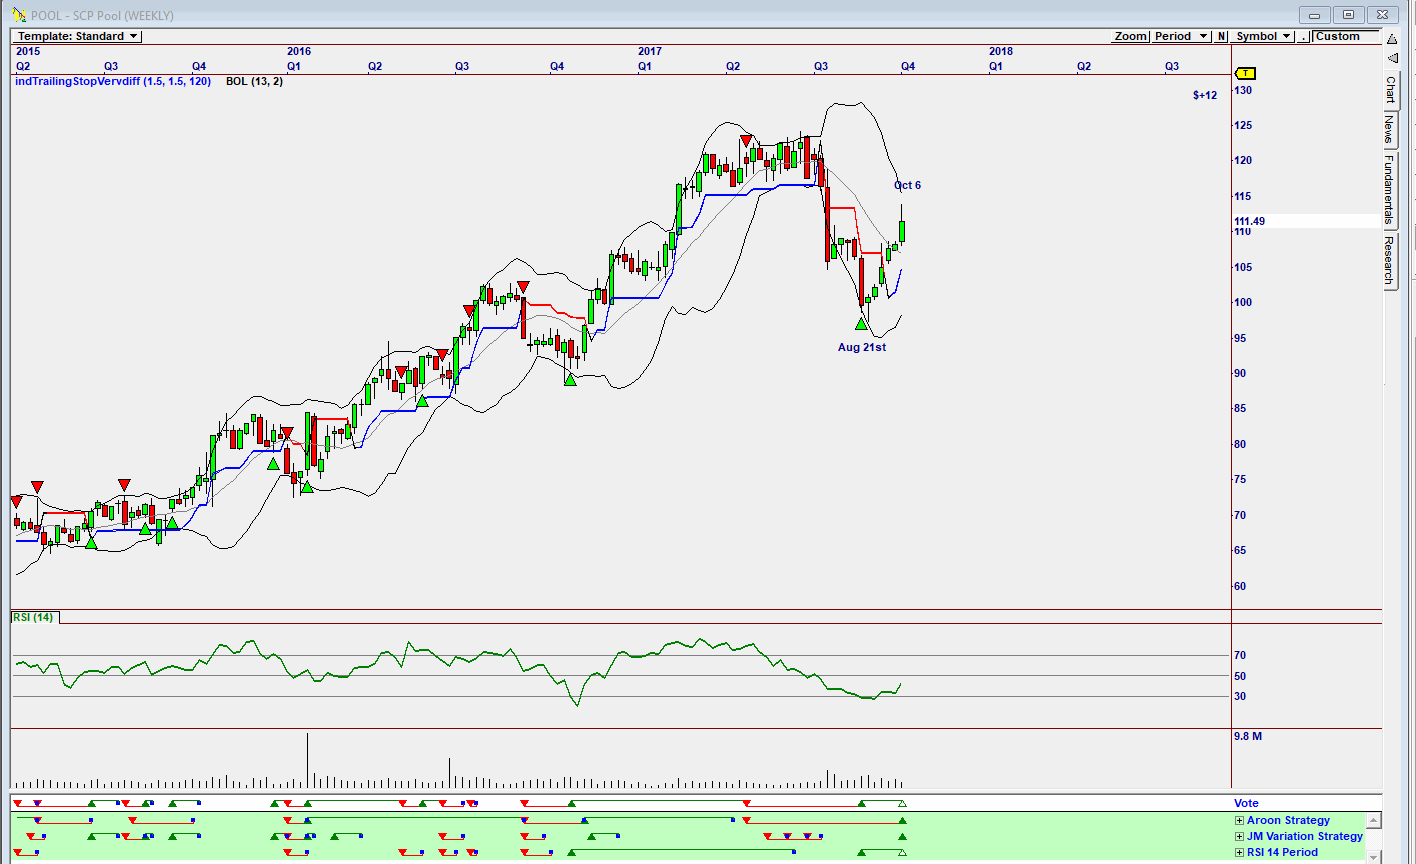
| Figure 2. Weekly chart showng a buy. |
| Graphic provided by: Omnitrader. |
| |
| Looking at the weekly Omnitrader chart, one can see that the RSI 14-period strategy gave a buy on the week ending August 21. The Aroon and JM Variation strategies only gave buy signals on the week ending October 6. |
|
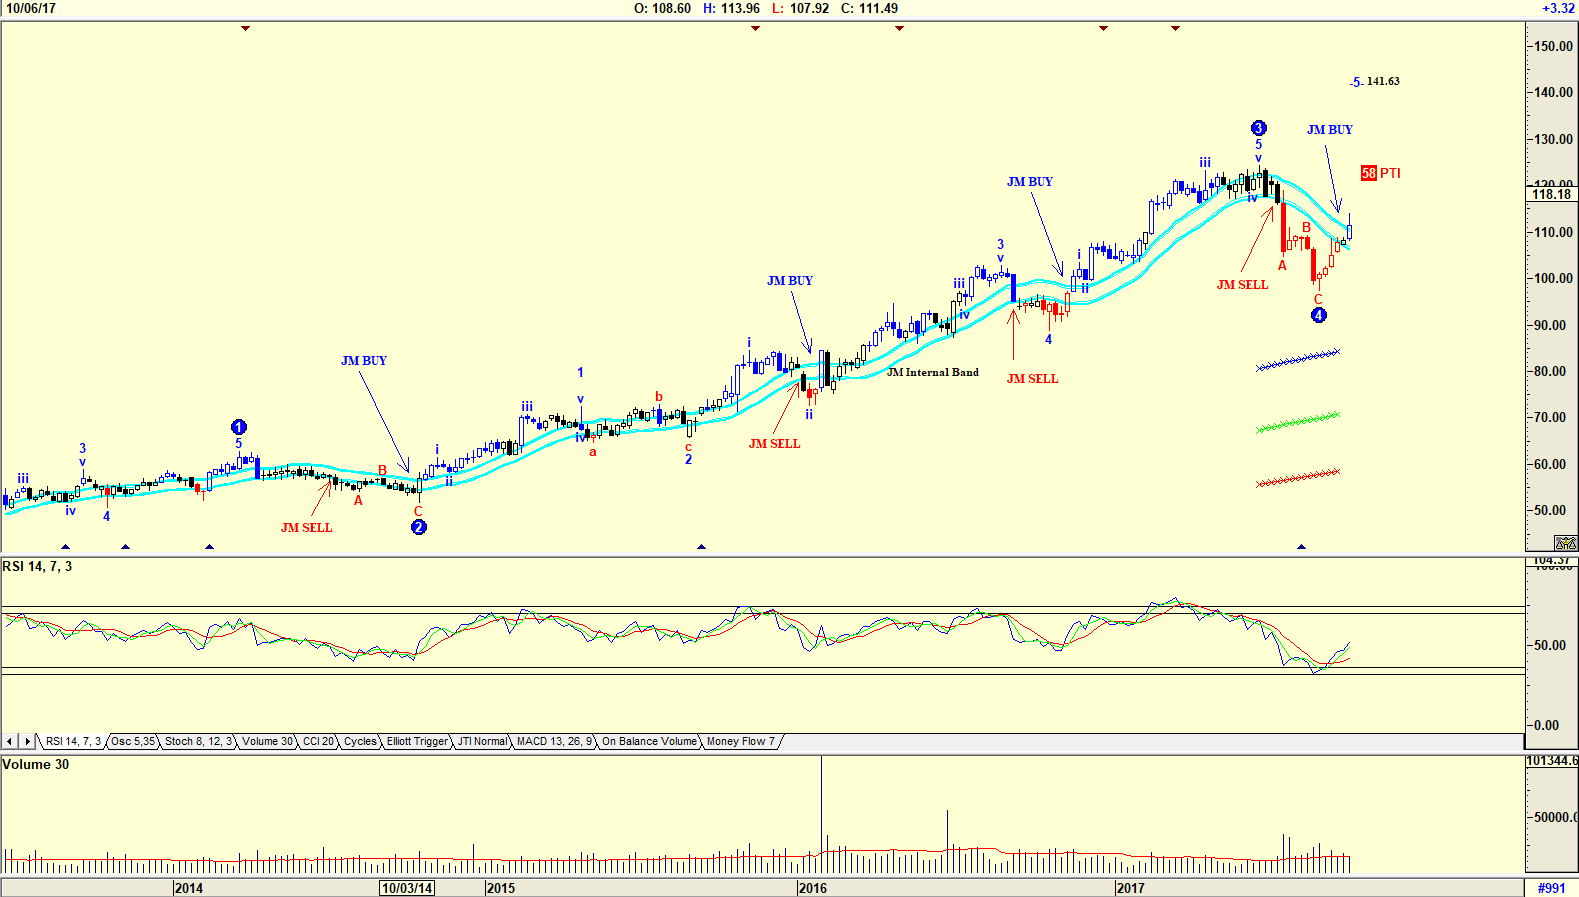
| Figure 3. Weekly chart with an Elliott wave count. |
| Graphic provided by: AdvancedGET. |
| |
| Looking at an Elliott wave count on a weekly chart one can see that the share price should rise in a WAVE 5. The PTI (Probability Index) is 58, suggesting that the share price could rise to $141.63. The RSI Indicator is suggesting strength as is the JM Internal Band shown on the chart. The JM Internal Band is a simple 15-period moving average offset by 2% positive and 2% negative. A move above the upper band suggests a buy and below the lower band a sell. |
|
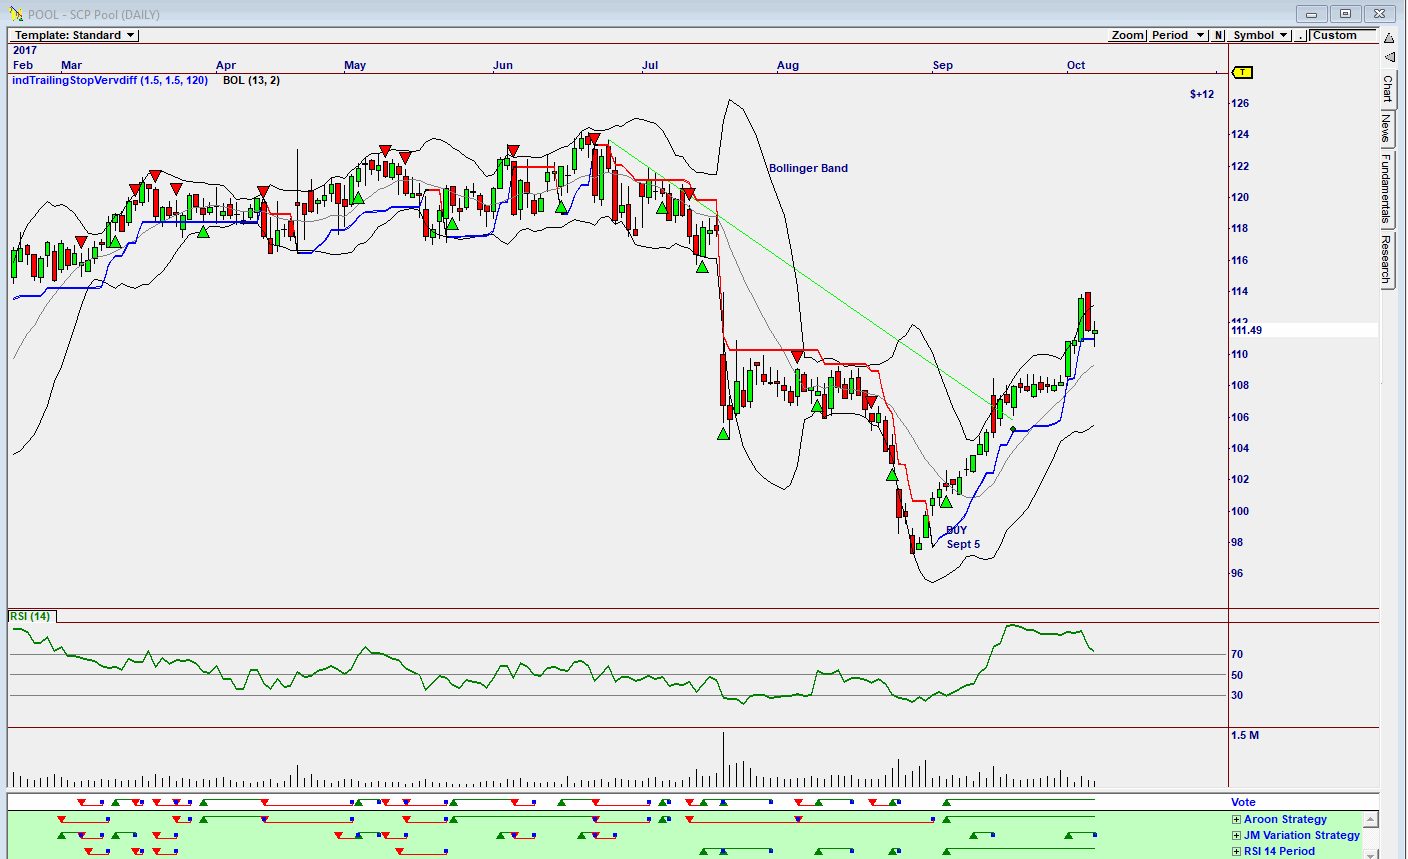
| Figure 4. Daily chart showing a buy. |
| Graphic provided by: Omnitrader.. |
| |
| The chart in Figure 4 is a daily Omnitrader chart showing a buy signal given on September 5 when the share price closed at $101.54. The buy signal shown on the Vote line is based on buy signals given by the AROON and RSI 14-period strategies. Do note the RSI 14 indicator which is presently at overbought levels. The share price is also testing the upper Bollinger Band suggesting weakness ahead. Finding the best strategy on the program you prefer using is something one continually works at. If one buys a share for the long term, then one probably looks at weekly or monthly charts. For traders, it is daily or Intraday charts. Whatever your preference, it is always test and more test, looking for the strategy that gives you the best profit over a year. |
Has been a technical analyst since 1969, and has worked as a futures and options trader with First Financial Futures in Johannesburg, South Africa.
| Address: | 3256 West 24th Ave |
| Vancouver, BC | |
| Phone # for sales: | 6042634214 |
| E-mail address: | petroosp@gmail.com |
Click here for more information about our publications!
PRINT THIS ARTICLE

Request Information From Our Sponsors
- VectorVest, Inc.
- Executive Premier Workshop
- One-Day Options Course
- OptionsPro
- Retirement Income Workshop
- Sure-Fire Trading Systems (VectorVest, Inc.)
- Trading as a Business Workshop
- VectorVest 7 EOD
- VectorVest 7 RealTime/IntraDay
- VectorVest AutoTester
- VectorVest Educational Services
- VectorVest OnLine
- VectorVest Options Analyzer
- VectorVest ProGraphics v6.0
- VectorVest ProTrader 7
- VectorVest RealTime Derby Tool
- VectorVest Simulator
- VectorVest Variator
- VectorVest Watchdog
- StockCharts.com, Inc.
- Candle Patterns
- Candlestick Charting Explained
- Intermarket Technical Analysis
- John Murphy on Chart Analysis
- John Murphy's Chart Pattern Recognition
- John Murphy's Market Message
- MurphyExplainsMarketAnalysis-Intermarket Analysis
- MurphyExplainsMarketAnalysis-Visual Analysis
- StockCharts.com
- Technical Analysis of the Financial Markets
- The Visual Investor