

HOT TOPICS LIST
- MACD
- Fibonacci
- RSI
- Gann
- ADXR
- Stochastics
- Volume
- Triangles
- Futures
- Cycles
- Volatility
- ZIGZAG
- MESA
- Retracement
- Aroon
INDICATORS LIST
LIST OF TOPICS
PRINT THIS ARTICLE
by Stella Osoba, CMT
After a painful decline lasting all of the past year, has Brinker Intl, Inc. (EAT) finally found support at the low of $29.50 reached on September 7, 2017?
Position: N/A
Stella Osoba, CMT
Stella Osoba is a trader and financial writer. She is a frequent contributor to "Technical Analysis of Stocks and Commodities" magazine and "Traders.com Advantage" as well as other financial publications.
PRINT THIS ARTICLE
TECHNICAL ANALYSIS
What Next for Brinker?
10/19/17 04:49:21 PMby Stella Osoba, CMT
After a painful decline lasting all of the past year, has Brinker Intl, Inc. (EAT) finally found support at the low of $29.50 reached on September 7, 2017?
Position: N/A
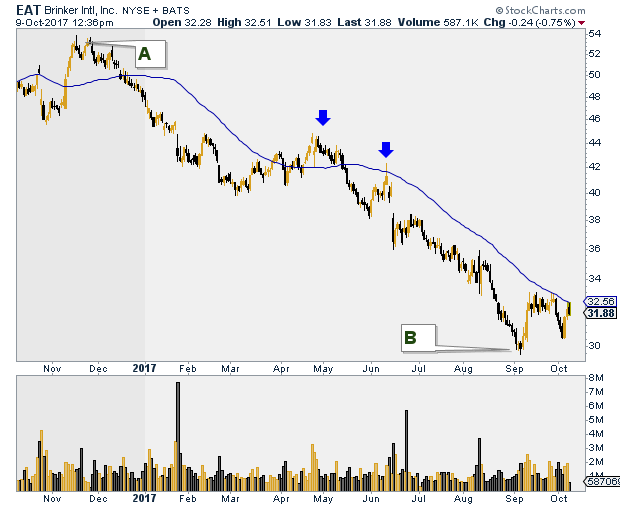
| EAT has been an underperforming stock for 2017. Its slide started on November 16, 2016 when it touched a high of $53.89 (see A on Figure 1). After which, it seemed that the stock could do nothing right. Earnest attempts to rise above its 50-day Moving Average (MA) were met with disappointment as the stock quickly lost any momentum it had gathered and swooned back below its 50-day MA (see blue arrows on Figure 1). |
|
| Figure 1: EAT has been in a downtrend for all of the past year. It may be testing its recent lows. |
| Graphic provided by: StockCharts.com. |
| |
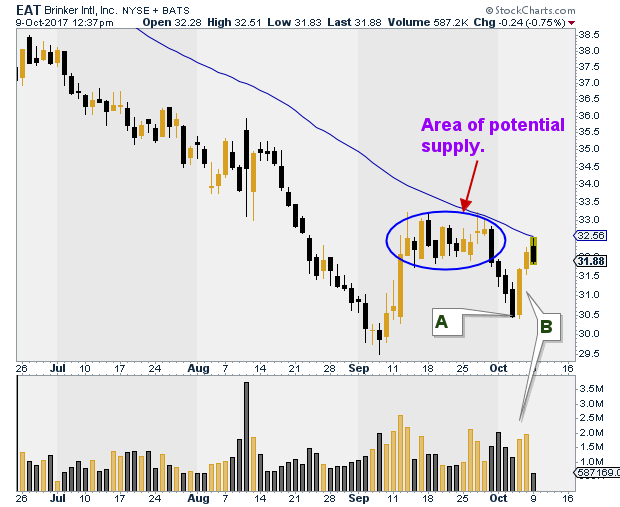
| The stock recently reached a low of $29.50 (see B on Figure 1) and it appears that attempts to test that low might be successful. On September 27, 2017, EAT found resistance at its 50-day MA. The next move was down, and a series of bearish bars ensued, taking price back down to $30.43, a higher low than that reached on September 7, 2017 (See A on Figure 2). Does this mean that the downtrend has ended and the next likely move is up? The next question to ask is, what information are we using to answer this most important of all questions, and do we have enough of it? |
|
| |
| As technicians, all we have is price. Everything else is derived from price. So studying our charts while asking these questions can yield some very important clues. In order for price to rise, buyers have to outnumber sellers. Which means that many of those who want to sell should have sold and new buyers must come in, in increasing numbers. This is often what results in the reaction we so often see on price charts. Price falls to a low, buyers, thinking there are bargains to be had now that price is more attractive than it has been step in. Earlier buyers who might have been holding onto losses, want out and sell as price rises resulting in a down-leg. More buyers step in and price rises accordingly. Has this happened here? |
| Two things that we want to see in a healthy breakout have not yet happened. Firstly, the stock has reacted to over half of the previous rise which is bearish. Secondly, there has not been the sort of breakout we should be looking for. On October 5, 2017, a strong bullish candle formed on rising volume (See B on Figure 2), but in a strong breakout we want to see a strong bullish candle on two to three times the volume of the previous day. Strong volume points to the sort of participation with the capacity to propel the stock upwards. Also, EAT has had trouble before at the 50-day MA. It is yet to test this level successfully. A successful test of the 50-day MA would also mean EAT has managed to rise above the potential area of supply indicated on the chart. |
| As with most stock trading, it often pays to wait. Wait to let price show you what it is doing, rather than anticipate. Stock trading is hard enough without having to be a fortune teller as well. The Fear of Missing Out (FOMA) syndrome is what makes many of us think we have to rise to the level of fortune tellers, but if we go back and study charts, one thing will become clear. Often after healthy breakouts, the stock will at some point react, and at the conclusion of a healthy reaction, which should be less than half of the previous move, there will be opportunities for the disciplined trader to enter a long trade. |
Stella Osoba is a trader and financial writer. She is a frequent contributor to "Technical Analysis of Stocks and Commodities" magazine and "Traders.com Advantage" as well as other financial publications.
| E-mail address: | stellaosoba@gmail.com |
Click here for more information about our publications!
PRINT THIS ARTICLE

Request Information From Our Sponsors
- VectorVest, Inc.
- Executive Premier Workshop
- One-Day Options Course
- OptionsPro
- Retirement Income Workshop
- Sure-Fire Trading Systems (VectorVest, Inc.)
- Trading as a Business Workshop
- VectorVest 7 EOD
- VectorVest 7 RealTime/IntraDay
- VectorVest AutoTester
- VectorVest Educational Services
- VectorVest OnLine
- VectorVest Options Analyzer
- VectorVest ProGraphics v6.0
- VectorVest ProTrader 7
- VectorVest RealTime Derby Tool
- VectorVest Simulator
- VectorVest Variator
- VectorVest Watchdog
- StockCharts.com, Inc.
- Candle Patterns
- Candlestick Charting Explained
- Intermarket Technical Analysis
- John Murphy on Chart Analysis
- John Murphy's Chart Pattern Recognition
- John Murphy's Market Message
- MurphyExplainsMarketAnalysis-Intermarket Analysis
- MurphyExplainsMarketAnalysis-Visual Analysis
- StockCharts.com
- Technical Analysis of the Financial Markets
- The Visual Investor