HOT TOPICS LIST
- MACD
- Fibonacci
- RSI
- Gann
- ADXR
- Stochastics
- Volume
- Triangles
- Futures
- Cycles
- Volatility
- ZIGZAG
- MESA
- Retracement
- Aroon
INDICATORS LIST
LIST OF TOPICS
PRINT THIS ARTICLE
by Koos van der Merwe
When the chart of a share rises strongly over a number of years, it becomes a share one should own for the long term.
Position: Buy
Koos van der Merwe
Has been a technical analyst since 1969, and has worked as a futures and options trader with First Financial Futures in Johannesburg, South Africa.
PRINT THIS ARTICLE
TECHNICAL ANALYSIS
A Share To Keep An Eye On
10/12/17 01:07:39 PMby Koos van der Merwe
When the chart of a share rises strongly over a number of years, it becomes a share one should own for the long term.
Position: Buy
| Cadence Design Systems, Inc. is an American multinational electronic design automation software and engineering services company. Its headquarters are in San Jose, California. The company employs 7,094 people as of December 2016. As of April 2017, the company is the fifth highest-paying for employees in the United States. |

|
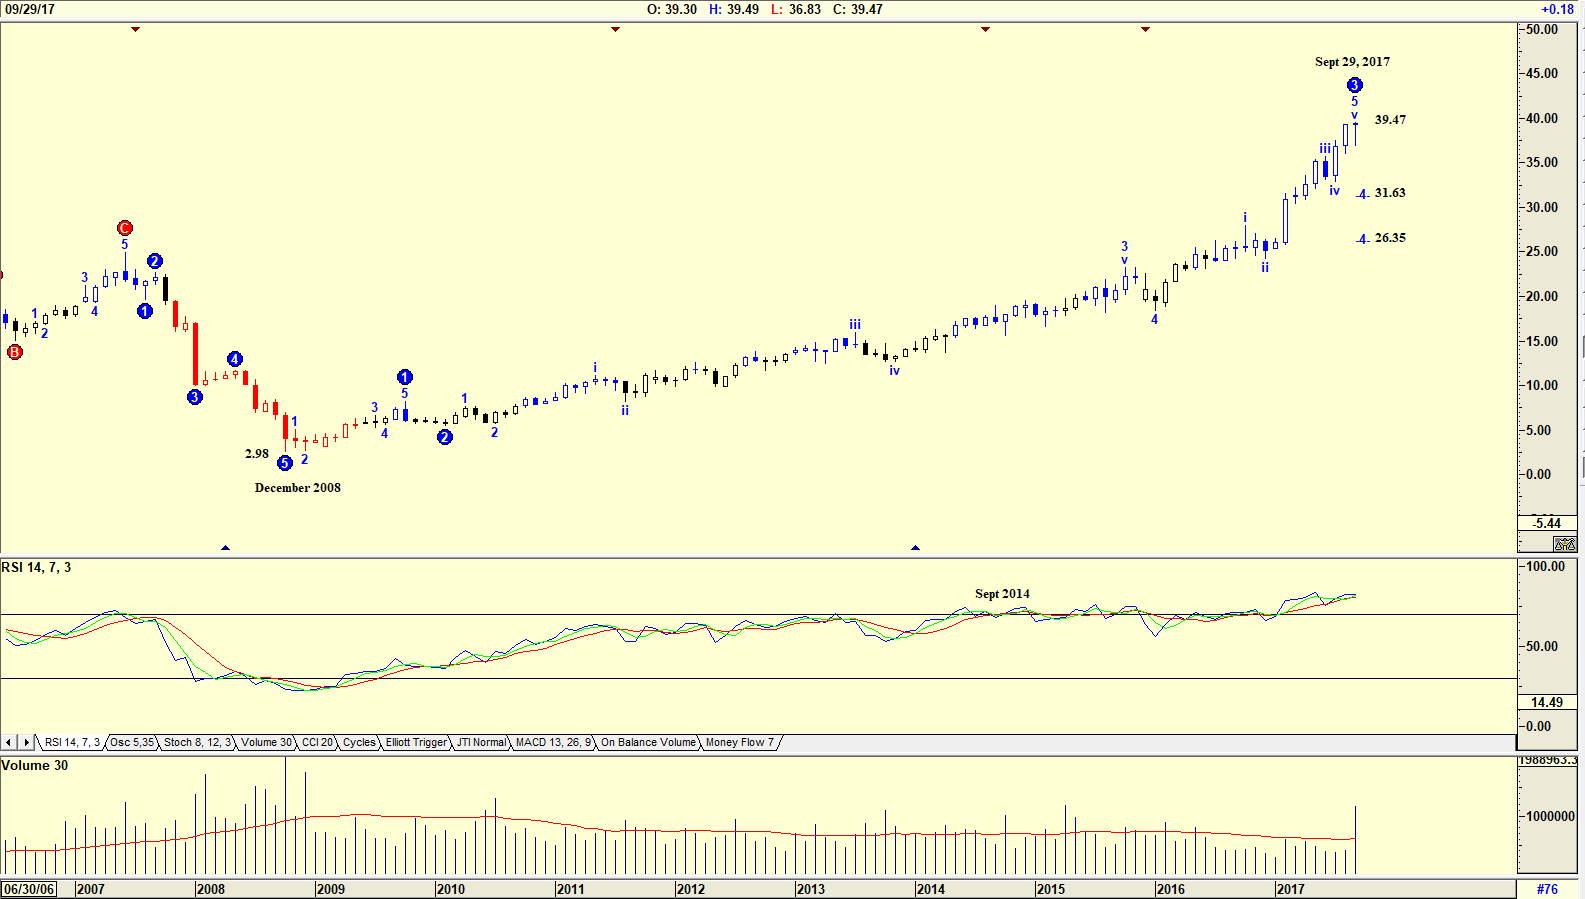
| Figure 1. Monthly chart with Elliott wave. |
| Graphic provided by: AdvancedGET. |
| |
| The chart in Figure 1 is a monthly chart showing how the share price rose from a low of $2.98 in December 2008 to the high of $39.47 by September 29. A look at Yahoo Finance shows that the company has a zero Dividend & Yield, which is a negative, but the fact that the share price rose from a low of $2.98 in December 2008 to its price of $39.47 as of September 29, is an attraction. Volume as shown on the chart has been reasonably constant. The 14-period RSI indicator which rose above the 70 horizontal and gave a sell signal by falling below the 70 horizontal a number of times was not an accurate monthly indicator. Volume, however, rose strongly as the share price hit $39.47 on September 29. The ElliottwWave count is suggesting that the share price could be completing a Wave 5 of WAVE 3 and could start falling in a WAVE 4 to $31.63 or $26.35. |

|
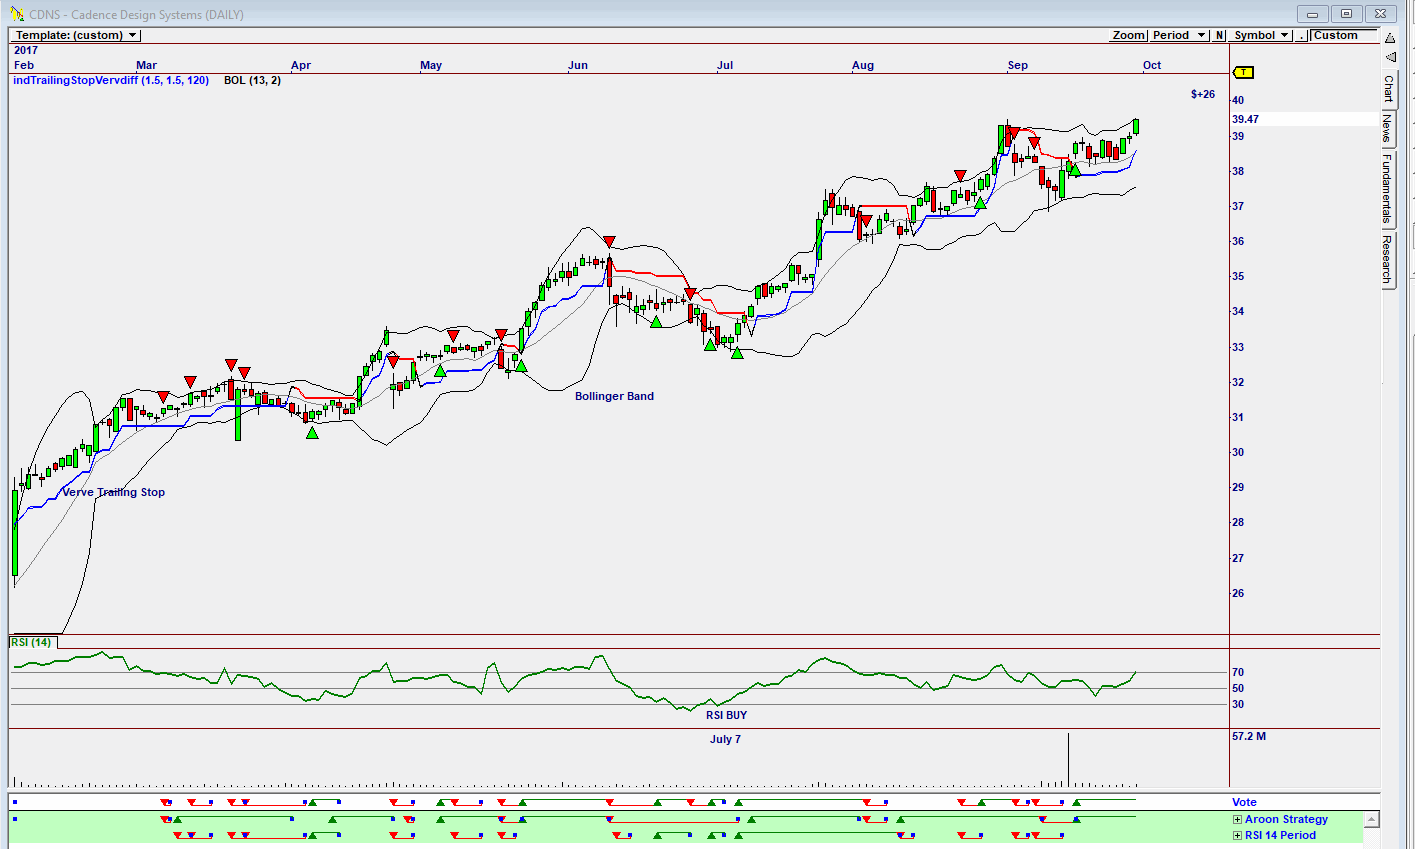
| Figure 2. Daily Omnitrader chart suggesting a buy. |
| Graphic provided by: Omnitrader. |
| |
| The chart in Figure 2 is a daily Omnitrader chart with the Vote line suggesting a buy based on the Aroon Strategy shown in green below the Vote line. A look back at the Vote line shows daily signals that have been reasonably accurate should one wish to trade the share rather than a buy and hold as suggested by the monthly chart. The RSI indicator on the chart did suggest a buy signal on July 7, but the indicator has not been that accurate having suggested sell signals when the Vote line suggested buy signals. The share price is presently testing the upper Bollinger band, suggesting that a sell signal could occur soon. The two charts above suggest that Cadence Design Systems is a share to buy and hold, with analysis only being done on a monthly basis. However, day traders could day trade the share profitably. |
Has been a technical analyst since 1969, and has worked as a futures and options trader with First Financial Futures in Johannesburg, South Africa.
| Address: | 3256 West 24th Ave |
| Vancouver, BC | |
| Phone # for sales: | 6042634214 |
| E-mail address: | petroosp@gmail.com |
Click here for more information about our publications!
PRINT THIS ARTICLE

|

Request Information From Our Sponsors
- StockCharts.com, Inc.
- Candle Patterns
- Candlestick Charting Explained
- Intermarket Technical Analysis
- John Murphy on Chart Analysis
- John Murphy's Chart Pattern Recognition
- John Murphy's Market Message
- MurphyExplainsMarketAnalysis-Intermarket Analysis
- MurphyExplainsMarketAnalysis-Visual Analysis
- StockCharts.com
- Technical Analysis of the Financial Markets
- The Visual Investor
- VectorVest, Inc.
- Executive Premier Workshop
- One-Day Options Course
- OptionsPro
- Retirement Income Workshop
- Sure-Fire Trading Systems (VectorVest, Inc.)
- Trading as a Business Workshop
- VectorVest 7 EOD
- VectorVest 7 RealTime/IntraDay
- VectorVest AutoTester
- VectorVest Educational Services
- VectorVest OnLine
- VectorVest Options Analyzer
- VectorVest ProGraphics v6.0
- VectorVest ProTrader 7
- VectorVest RealTime Derby Tool
- VectorVest Simulator
- VectorVest Variator
- VectorVest Watchdog
