

HOT TOPICS LIST
- MACD
- Fibonacci
- RSI
- Gann
- ADXR
- Stochastics
- Volume
- Triangles
- Futures
- Cycles
- Volatility
- ZIGZAG
- MESA
- Retracement
- Aroon
INDICATORS LIST
LIST OF TOPICS
PRINT THIS ARTICLE
by Stella Osoba, CMT
With Amazon's (AMZN) recent purchase of Wholefoods Market, it looks like there is no stopping this juggernaut of a stock. But what does a study of the price chart reveal about the performance of this stock?
Position: N/A
Stella Osoba, CMT
Stella Osoba is a trader and financial writer. She is a frequent contributor to "Technical Analysis of Stocks and Commodities" magazine and "Traders.com Advantage" as well as other financial publications.
PRINT THIS ARTICLE
HEAD & SHOULDERS
What Next for The Juggernaut That is Amazon?
09/28/17 04:15:38 PMby Stella Osoba, CMT
With Amazon's (AMZN) recent purchase of Wholefoods Market, it looks like there is no stopping this juggernaut of a stock. But what does a study of the price chart reveal about the performance of this stock?
Position: N/A
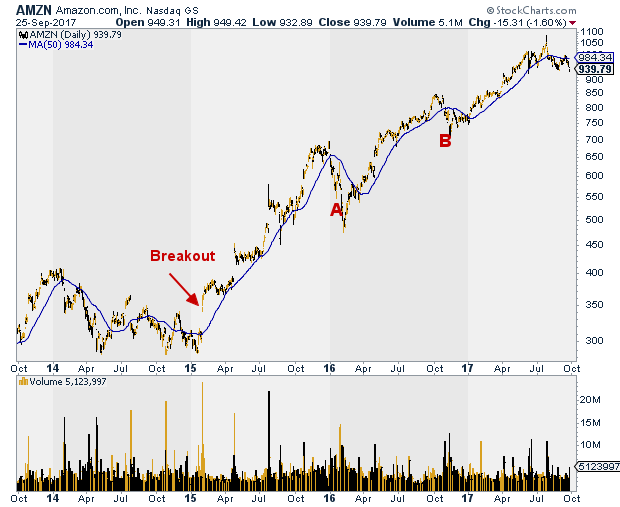
| AMZN broke out of its trading range in early 2015. Since then its rise has been nothing short of amazing. From a low of $340.74 when it broke out on January 30, 2015, to the high of $1083.31 reached on July 27, 2017, the stock has seemed invincible (See Figure 1). With the stock now appearing to form a head-and-shoulders topping pattern, the question is, "What's next for AMZN?" Is it set for a lengthy decline or will the reaction currently unfolding lead to even more dizzying price rises? |
|
| Figure 1. A long-term chart of AMZN showing its lengthy uptrend. |
| Graphic provided by: StockCharts.com. |
| |
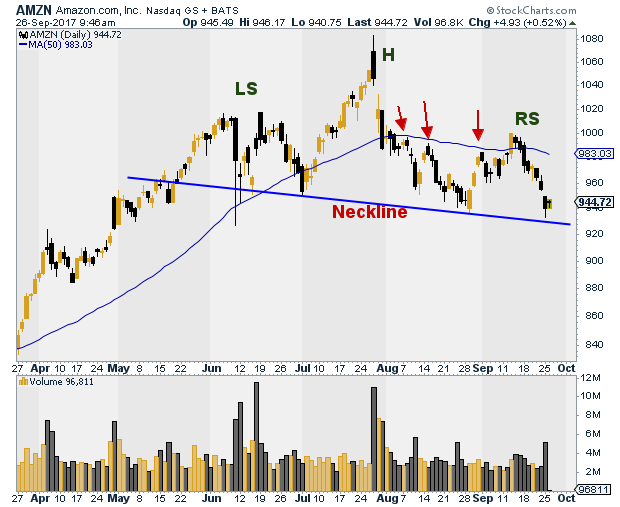
| On September 22, 2017, AMZN closed at $955.10 and price is currently below its 50-day moving average (MA). What does a careful reading of its price chart tell us, if anything, about the likely future trend of the chart? To state the obvious, in an uptrend, we like to see higher highs and higher lows, and in a downtrend, lower highs and lower lows. A quick look at Figure 2 will show that after the price high reached on July 27, 2017, the next series of highs found resistance at the 50-day MA (see arrows). The most recent high that AMZN formed was able to breach the 50-day MA on the upside, but the next day, bears were able to overcome the bulls and price retreated once more to the downside. Price quickly lost ground and plunged below the 50-day MA. The resulting downward move completed a complex head-and-shoulders chart pattern. |
|
| Figure 2. AMZN's complex Head-and-Shoulders pattern. |
| Graphic provided by: StockCharts.com. |
| |
| A head-and-shoulders pattern is a bearish reversal chart pattern, but like all technical analysis chart patterns, there is always the possibility of failure. Failure in this case will mean that the pattern will fail to break the neckline and instead begin to move upwards. So, to trade this bearish pattern, it is best to wait for confirmation. This means, waiting on the sidelines for price to move decisively below the neckline. If that happens, then it is more likely that the next move for AMZN will see price fall to about $830. This price is derived by measuring the extent of the rise from the neckline to the price high and then deducting that amount from the price at the neckline. |
| While it is obvious that if AMZN breaks decisively below its neckline, the most likely next move is down and if this happens price could easily give back 100 points or more to the downside. A significant drop no doubt. But would this be the time to give up on the stock? Not necessarily. Remember that AMZN is a volatile stock. Price moves to the up or downside of one hundred points or more can and do happen. For example, on December 29, 2015 (see Figure 1: A) price reached a high of $696.44, but by February 8, 2016, the stock's price was down to a low of $475.21; a drop of over 200 points. On October 6, 2016, (See Figure 1: B) AMZN touched a high of $847.21, but by November 14, 2016, it had plunged to a low of $710.10. |
| AMZN is an expensive stock that is also very volatile. This makes it an additionally risky stock to trade. But trading it well can be lucrative, so take the time to study how it moves, and only take a position when you thoroughly understand the stock. |
Stella Osoba is a trader and financial writer. She is a frequent contributor to "Technical Analysis of Stocks and Commodities" magazine and "Traders.com Advantage" as well as other financial publications.
| E-mail address: | stellaosoba@gmail.com |
Click here for more information about our publications!
PRINT THIS ARTICLE

Request Information From Our Sponsors
- StockCharts.com, Inc.
- Candle Patterns
- Candlestick Charting Explained
- Intermarket Technical Analysis
- John Murphy on Chart Analysis
- John Murphy's Chart Pattern Recognition
- John Murphy's Market Message
- MurphyExplainsMarketAnalysis-Intermarket Analysis
- MurphyExplainsMarketAnalysis-Visual Analysis
- StockCharts.com
- Technical Analysis of the Financial Markets
- The Visual Investor
- VectorVest, Inc.
- Executive Premier Workshop
- One-Day Options Course
- OptionsPro
- Retirement Income Workshop
- Sure-Fire Trading Systems (VectorVest, Inc.)
- Trading as a Business Workshop
- VectorVest 7 EOD
- VectorVest 7 RealTime/IntraDay
- VectorVest AutoTester
- VectorVest Educational Services
- VectorVest OnLine
- VectorVest Options Analyzer
- VectorVest ProGraphics v6.0
- VectorVest ProTrader 7
- VectorVest RealTime Derby Tool
- VectorVest Simulator
- VectorVest Variator
- VectorVest Watchdog