HOT TOPICS LIST
- MACD
- Fibonacci
- RSI
- Gann
- ADXR
- Stochastics
- Volume
- Triangles
- Futures
- Cycles
- Volatility
- ZIGZAG
- MESA
- Retracement
- Aroon
INDICATORS LIST
LIST OF TOPICS
PRINT THIS ARTICLE
by Koos van der Merwe
With the recent name calling and threats between President Trump, North Korea and Iran, another look at the gold price is necessary. Historically, gold has traded inversely to the US$ but this is no longer the case. Gold is becoming a hedge against world tension.
Position: Buy
Koos van der Merwe
Has been a technical analyst since 1969, and has worked as a futures and options trader with First Financial Futures in Johannesburg, South Africa.
PRINT THIS ARTICLE
TECHNICAL ANALYSIS
Another Look At The Gold Price
10/05/17 03:38:03 PMby Koos van der Merwe
With the recent name calling and threats between President Trump, North Korea and Iran, another look at the gold price is necessary. Historically, gold has traded inversely to the US$ but this is no longer the case. Gold is becoming a hedge against world tension.
Position: Buy
| President Trump's statement in the UN where he attacked North Korea, calling Kim Jong Un a "Rocket Man" on "a suicide mission" was against the advice of his senior aides who repeatedly warned him not to deliver a personal attack. On Thursday, September 21, Kim reacted angrily to Trump's remarks and actions, calling the President a "mentally deranged U.S. dotard". North Korea's foreign minister said in New York that his country may test a hydrogen bomb in the Pacific Ocean to fulfill Kim's vow to take the "highest-level" action against the United States. With Iran thumbing its nose at President Trump after his criticism of Iran's missile program and the 2015 nuclear deal with the country, they launched a rocket on September 23, which Tehran says can carry several warheads. Tensions between Iran and the U.S. are increasing. Will President Trump go to war, as he says he will, if North Korea or Iran attack the United States? Will either country attack the United States? What does the gold price say? |

|
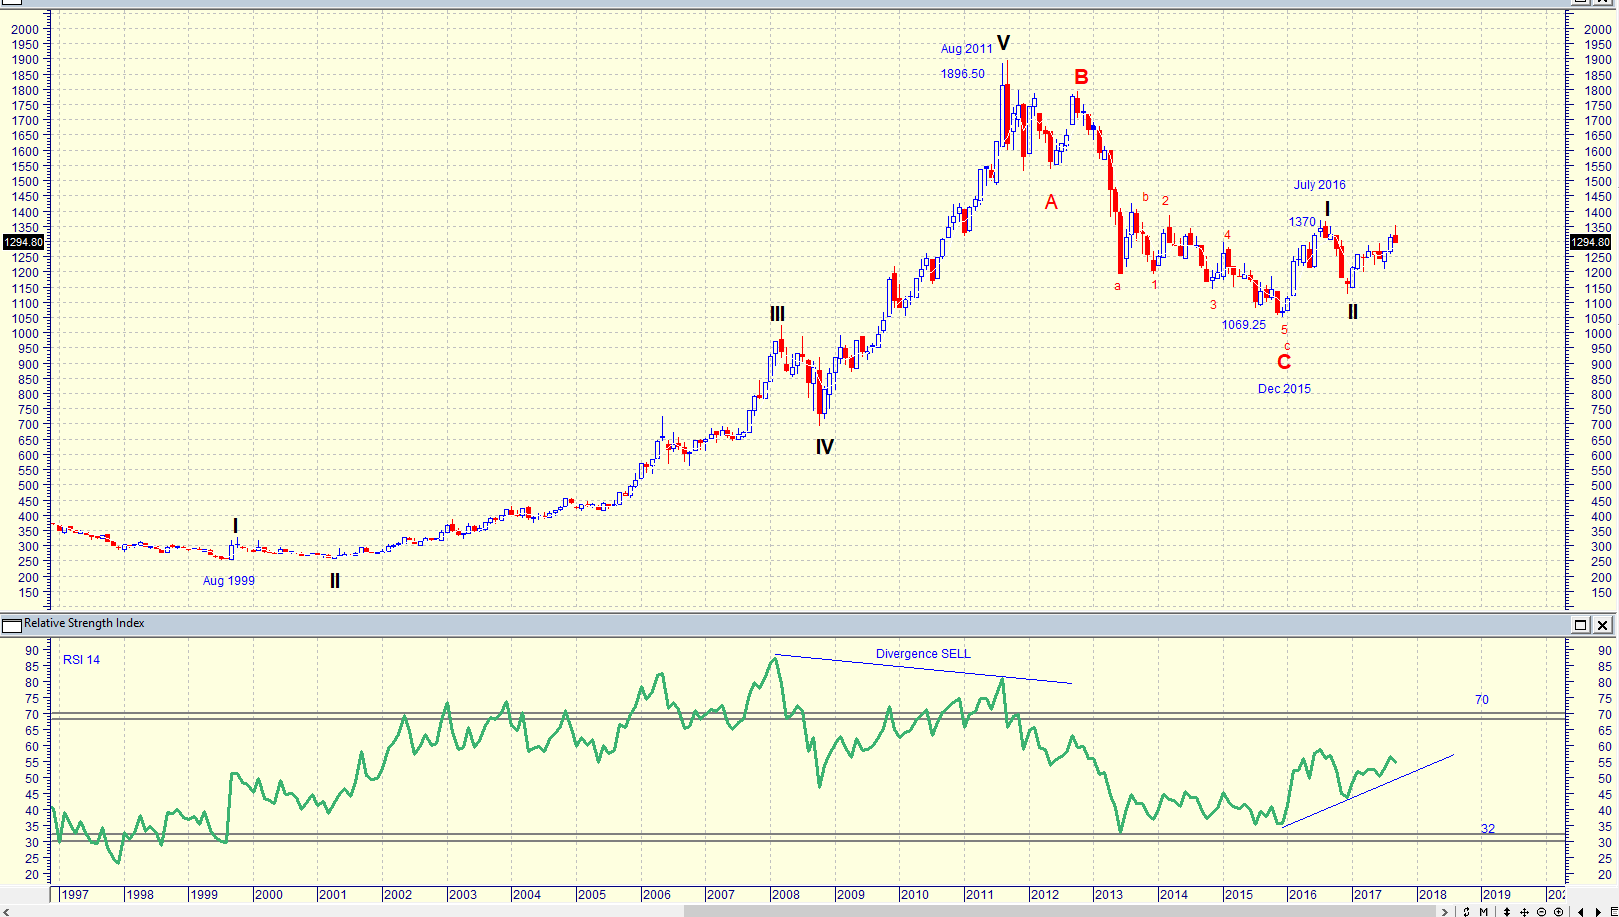
| Figure 1. Monthly chart of the Gold price. |
| Graphic provided by: MetaStock. |
| |
| The chart in Figure 1 is a monthly chart of the gold price with an Elliott wave count suggesting that the price is in a Wave III. This will be confirmed should the gold price rise above the high of Wave I at $1370. Should this not occur, then the gold price will retrace in an ABC correction, but not falling below $1069.25, the WAVE C bottom. However, with the RSI indicator rising, a break above 1370 looks very likely. |

|
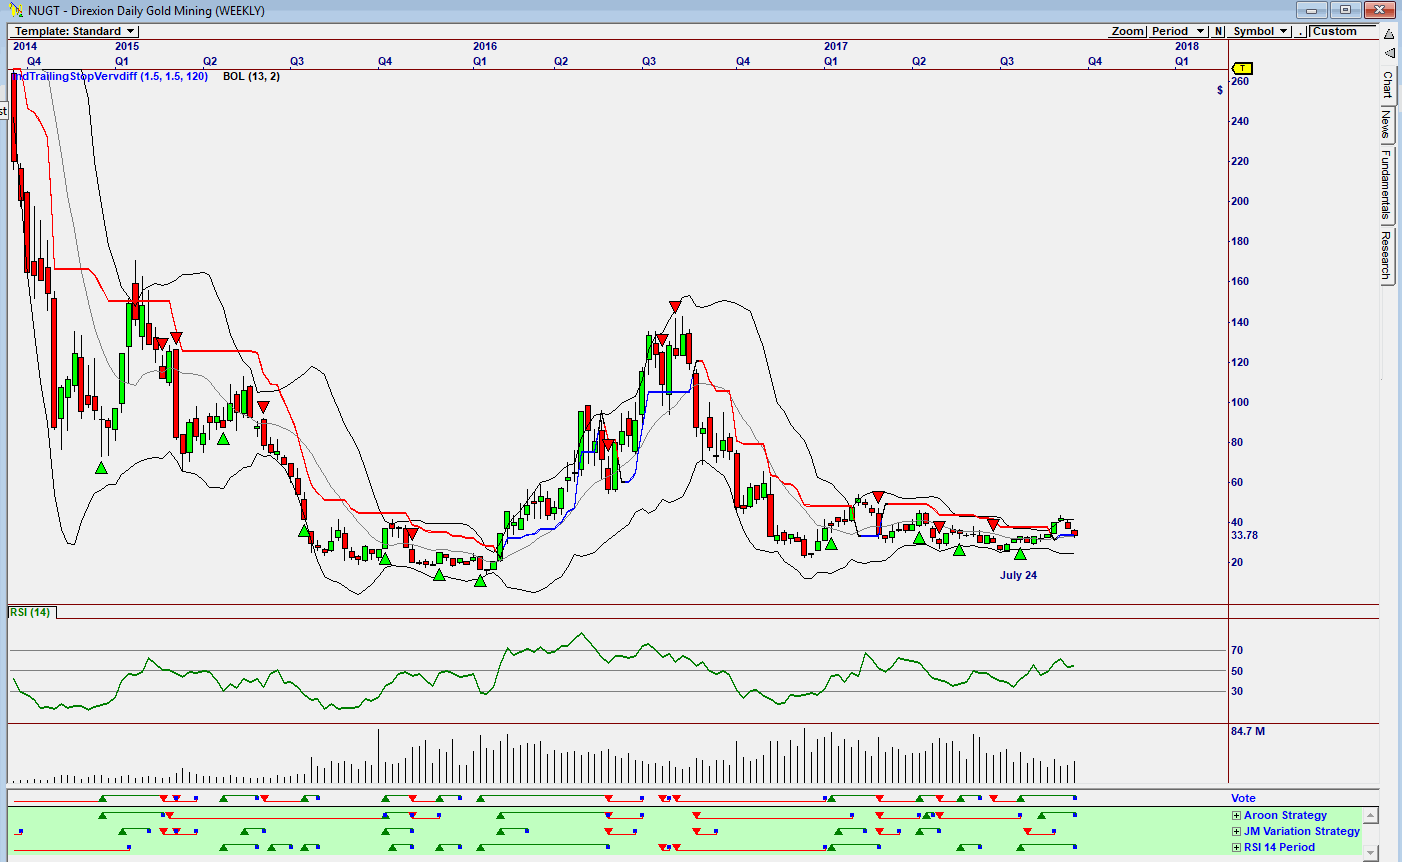
| Figure 2. Weekly chart of NUGT. |
| Graphic provided by: Omnitrader. |
| |
| Looking at a chart of Direxion Gold (NUGT) on a weekly chart, we can see that a buy was given on July 24. The Direxion Gold Miners Bull ETF as a 3x leveraged exchange-traded fund. The ETF attempts to track inverse the performance of the NYSE Arca Gold Miners Index via futures contracts, short positions, reverse purchase agreements, options, swap agreements and similar exotic trading tactics. In other words, it measures and tracks how traders think about the movement in the Gold price. With a buy signal given on July 24, as shown on the weekly chart, one wonders whether the investors and traders are truly nervous about world growing tension. |

|
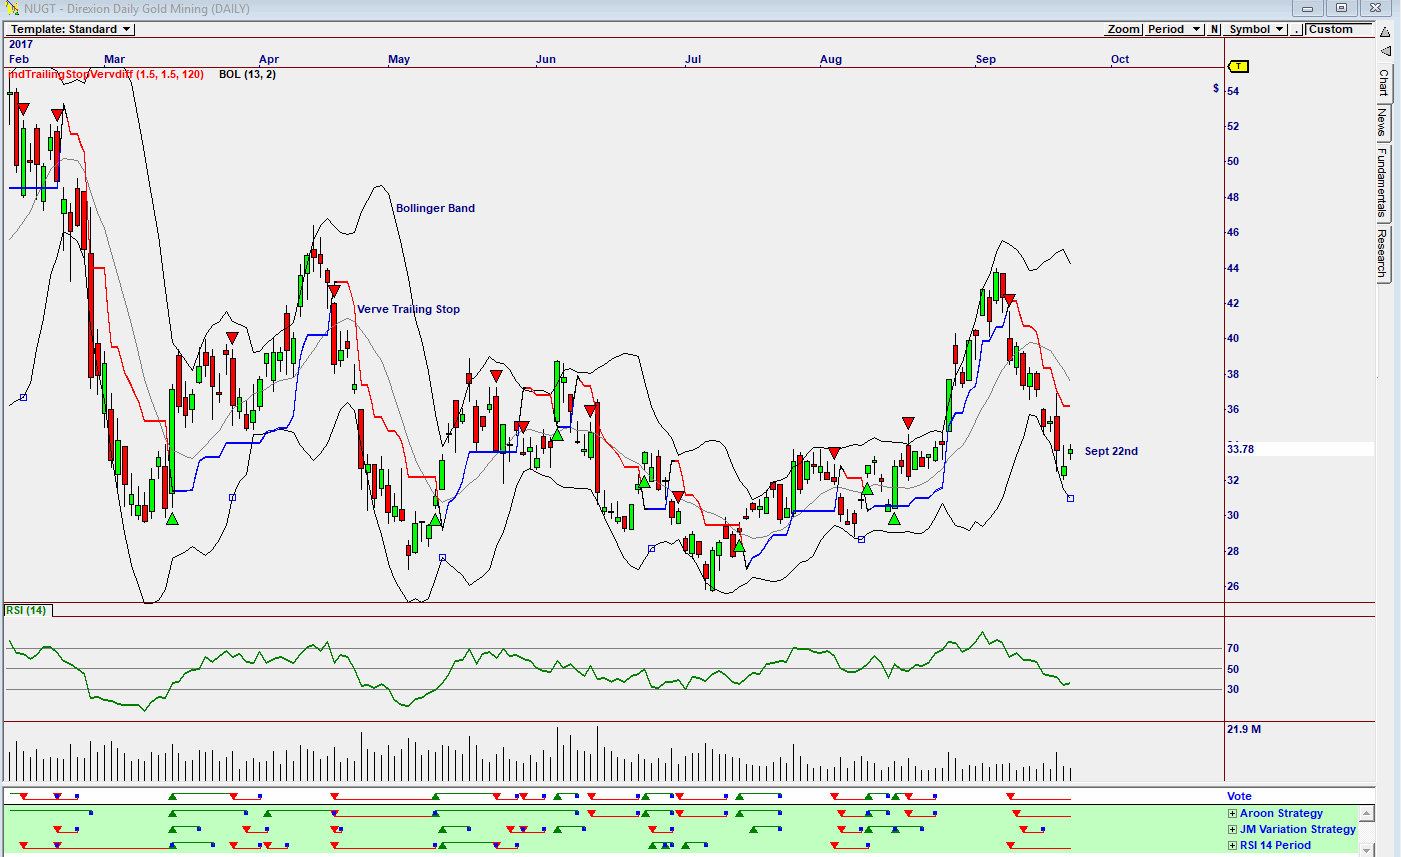
| Figure 3. Daily chart of NUGT. |
| Graphic provided by: Omnitrader. |
| |
| The Daily chart as shown in Figure 3 shows the Vote line still negative based on the Aroon and RSI-14 period strategies. The RSI indicator is at oversold levels and the move up of the share price on September 22 suggests that a buy signal could be given in the near future. |

|
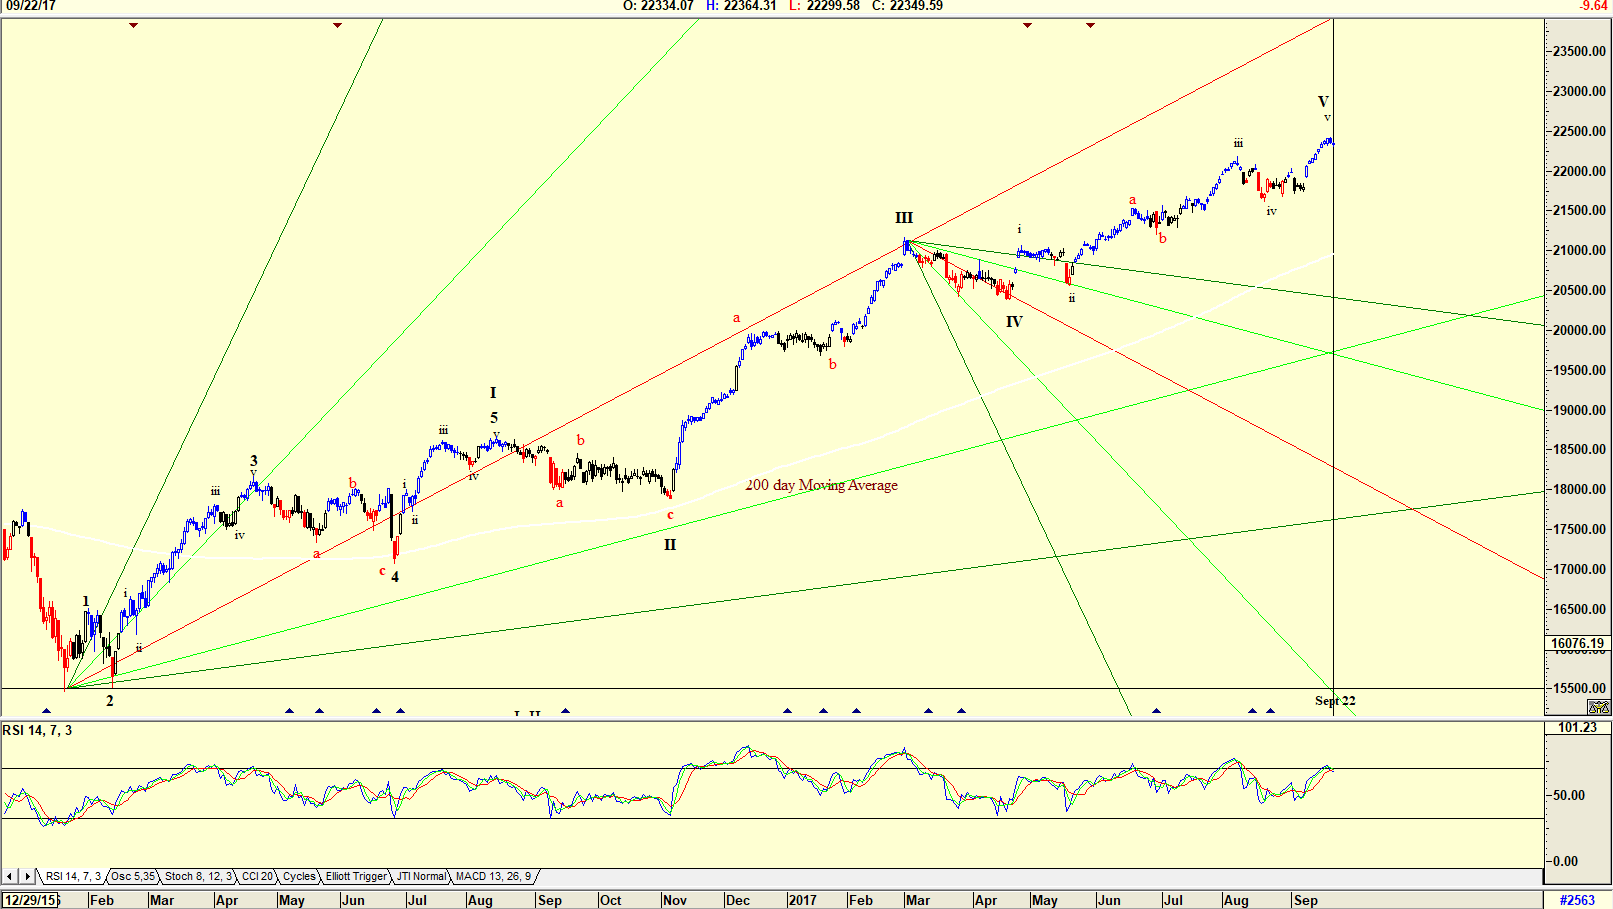
| Figure 4. Daily chart of the Dow Jones Index. |
| Graphic provided by: AdvancedGET. |
| |
| The chart in Figure 4 is a daily chart of the Dow Jones with an Elliott wave count suggesting that the Dow is tracing a WAVE V. The Gann Fan shown on the chart is suggesting that the DOW could correct on September 22, give or take a few days either side. The RSI indicator is at overbought levels suggesting a correction is due. With political tension increasing throughout the world, one can only hope that it is all "name calling", and nothing more serious, but caution does prevail. Look to Gold as a hedge should that "name calling" explode to something more serious. |
Has been a technical analyst since 1969, and has worked as a futures and options trader with First Financial Futures in Johannesburg, South Africa.
| Address: | 3256 West 24th Ave |
| Vancouver, BC | |
| Phone # for sales: | 6042634214 |
| E-mail address: | petroosp@gmail.com |
Click here for more information about our publications!
PRINT THIS ARTICLE

Request Information From Our Sponsors
- StockCharts.com, Inc.
- Candle Patterns
- Candlestick Charting Explained
- Intermarket Technical Analysis
- John Murphy on Chart Analysis
- John Murphy's Chart Pattern Recognition
- John Murphy's Market Message
- MurphyExplainsMarketAnalysis-Intermarket Analysis
- MurphyExplainsMarketAnalysis-Visual Analysis
- StockCharts.com
- Technical Analysis of the Financial Markets
- The Visual Investor
- VectorVest, Inc.
- Executive Premier Workshop
- One-Day Options Course
- OptionsPro
- Retirement Income Workshop
- Sure-Fire Trading Systems (VectorVest, Inc.)
- Trading as a Business Workshop
- VectorVest 7 EOD
- VectorVest 7 RealTime/IntraDay
- VectorVest AutoTester
- VectorVest Educational Services
- VectorVest OnLine
- VectorVest Options Analyzer
- VectorVest ProGraphics v6.0
- VectorVest ProTrader 7
- VectorVest RealTime Derby Tool
- VectorVest Simulator
- VectorVest Variator
- VectorVest Watchdog
