HOT TOPICS LIST
- MACD
- Fibonacci
- RSI
- Gann
- ADXR
- Stochastics
- Volume
- Triangles
- Futures
- Cycles
- Volatility
- ZIGZAG
- MESA
- Retracement
- Aroon
INDICATORS LIST
LIST OF TOPICS
PRINT THIS ARTICLE
by Stella Osoba, CMT
Sometimes we look at a chart that is in a strong downtrend and are tempted to jump to the conclusion that the stock has fallen too far down and therefore act in anticipation of a rise.
Position: N/A
Stella Osoba, CMT
Stella Osoba is a trader and financial writer. She is a frequent contributor to "Technical Analysis of Stocks and Commodities" magazine and "Traders.com Advantage" as well as other financial publications.
PRINT THIS ARTICLE
TECHNICAL ANALYSIS
How Low is Too Low?
09/14/17 03:37:55 PMby Stella Osoba, CMT
Sometimes we look at a chart that is in a strong downtrend and are tempted to jump to the conclusion that the stock has fallen too far down and therefore act in anticipation of a rise.
Position: N/A
| Since rising to a high of $758.61 on August 5, 2015, Chipotle Mexican Grill (CMG) has been on a lengthy downtrend. (See Figure 1.) On August 23, 2017, almost two years after its peak, CMG closed at a low of $297.09. So, would a reading of price action tell us whether can we expect CMG to make further lows, or has it bottomed? Are there any clues that a study of recent price action will yield about the next likely direction of the stock's price? Is there anything about CMG's price behavior that would be useful or otherwise, in helping us arrive at a conclusion about the likely future behavior of this stock? |

|
| Figure 1. CMG in a lengthy downtrend. |
| Graphic provided by: StockCharts.com. |
| |
| Technicians use probabilities to try to determine the likely future direction of price. Because the future is uncertain and unforeseeable events can affect the direction of price, the best a technician can do is give a forecast with varying degrees of probabilities; never certainties. Also, when attempting to predict the likely future direction of price, the market is constantly giving us new information which can influence the earlier forecast and lead to a markedly different outlook. With this in mind, let us analyze the price chart of CMG for clues to its future behavior. |

|
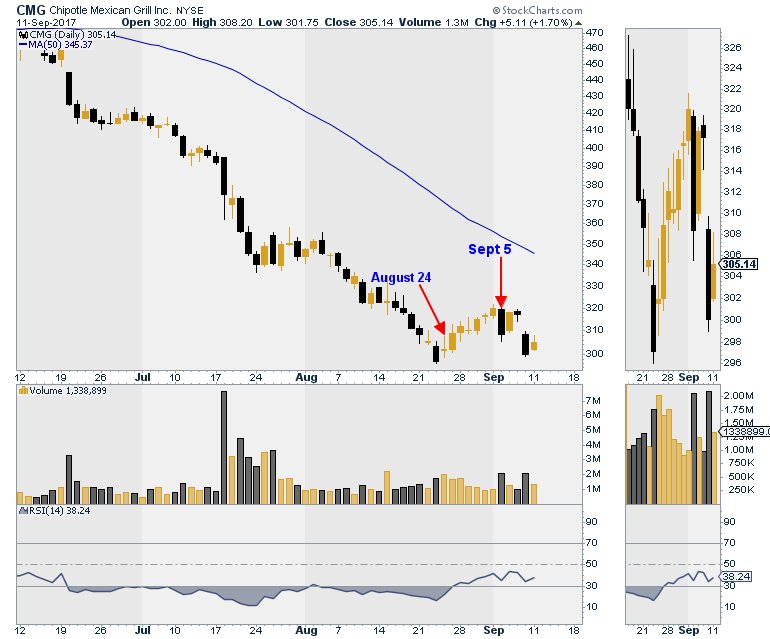
| Figure 2. CMG Daily. Waiting for confirmation of a new bull trend. |
| Graphic provided by: StockCharts.com. |
| |
| This analysis starts from August 24, 2017 and ends on September 11, 2017. (See Figure 2.) From August 24 until September 1, 2017, price rose unconvincingly. This was because, though the bars were all bullish, they were mostly weak bullish bars, some with long upper tails, others with small to nonexistent real bodies. During this period, the price bars were mostly overlapping which was another sign that the rise was labored and unconvincing. Also, volume was supporting the weakness of the new trend because as price rose, volume declined. So, when price broke downwards on September 5, 2017, forming a long bearish candle, there had been sufficient foreshadowing. |
| There is always the temptation to try to call the low. To say after an extended decline such as this that "this stock has moved down far enough, it has to rise at some point, I will get in early." But attempting to guess at a low nearly always leads to losses and regret. Use discipline and correct principles to analyze price action. With this in mind, we look at Figuer 2. The next candle after the large bearish candle on September 5 (marked), was a bullish candle with a bearish message. It formed an inside day, or in candle stick lingo, a harami, with the previous candle, which signals indecision. So, you wait and watch. The next day which was September 7 produced a bearish candle. Still no reason to initiate a long position. Our suspicion on the bearish nature of the chart was proven correct the following day when price gapped down and formed a bearish candle. The last day of our analysis is on September 11, 2017. The bullish candle on this day formed another inside day with the bearish candle of the previous day. More indecision, more reason to stand aside and wait. |
| Based on the price action so far, there is not enough convincing bullish price action to warrant initiating a long position. Just because price has been in a downtrend for the past two years, does not make it low enough to enter a long position, since it is possible that on a break below $296, the next likely price action will be down. So, to the question, how low is too low? The answer should probably be, it can always go lower. |
Stella Osoba is a trader and financial writer. She is a frequent contributor to "Technical Analysis of Stocks and Commodities" magazine and "Traders.com Advantage" as well as other financial publications.
| E-mail address: | stellaosoba@gmail.com |
Click here for more information about our publications!
PRINT THIS ARTICLE

Request Information From Our Sponsors
- StockCharts.com, Inc.
- Candle Patterns
- Candlestick Charting Explained
- Intermarket Technical Analysis
- John Murphy on Chart Analysis
- John Murphy's Chart Pattern Recognition
- John Murphy's Market Message
- MurphyExplainsMarketAnalysis-Intermarket Analysis
- MurphyExplainsMarketAnalysis-Visual Analysis
- StockCharts.com
- Technical Analysis of the Financial Markets
- The Visual Investor
- VectorVest, Inc.
- Executive Premier Workshop
- One-Day Options Course
- OptionsPro
- Retirement Income Workshop
- Sure-Fire Trading Systems (VectorVest, Inc.)
- Trading as a Business Workshop
- VectorVest 7 EOD
- VectorVest 7 RealTime/IntraDay
- VectorVest AutoTester
- VectorVest Educational Services
- VectorVest OnLine
- VectorVest Options Analyzer
- VectorVest ProGraphics v6.0
- VectorVest ProTrader 7
- VectorVest RealTime Derby Tool
- VectorVest Simulator
- VectorVest Variator
- VectorVest Watchdog
