HOT TOPICS LIST
- MACD
- Fibonacci
- RSI
- Gann
- ADXR
- Stochastics
- Volume
- Triangles
- Futures
- Cycles
- Volatility
- ZIGZAG
- MESA
- Retracement
- Aroon
INDICATORS LIST
LIST OF TOPICS
PRINT THIS ARTICLE
by Koos van der Merwe
Lululemon Athletica, Inc. is a Canadian self-described yoga-inspired athletic apparel company, designer and retailer.
Position: Buy
Koos van der Merwe
Has been a technical analyst since 1969, and has worked as a futures and options trader with First Financial Futures in Johannesburg, South Africa.
PRINT THIS ARTICLE
ELLIOTT WAVE
Buying Lululemon
09/19/17 04:35:58 PMby Koos van der Merwe
Lululemon Athletica, Inc. is a Canadian self-described yoga-inspired athletic apparel company, designer and retailer.
Position: Buy
| "Technical gear for run, yoga and training. Free shipping on all orders." That is their Google advert with photos of virtually everything they manufacture. Prices have been reduced by about 40% on all their products because they announced, "WE MADE TOO MUCH!" The stock price surged after earnings beat expectations, but analysts are worried that athletic apparel as a fashion outside the gym could be coming to an end. However, the CEO is confident of hitting $4 billion in revenue by 2020. Looking at the charts tells one what investors think of the company. |

|
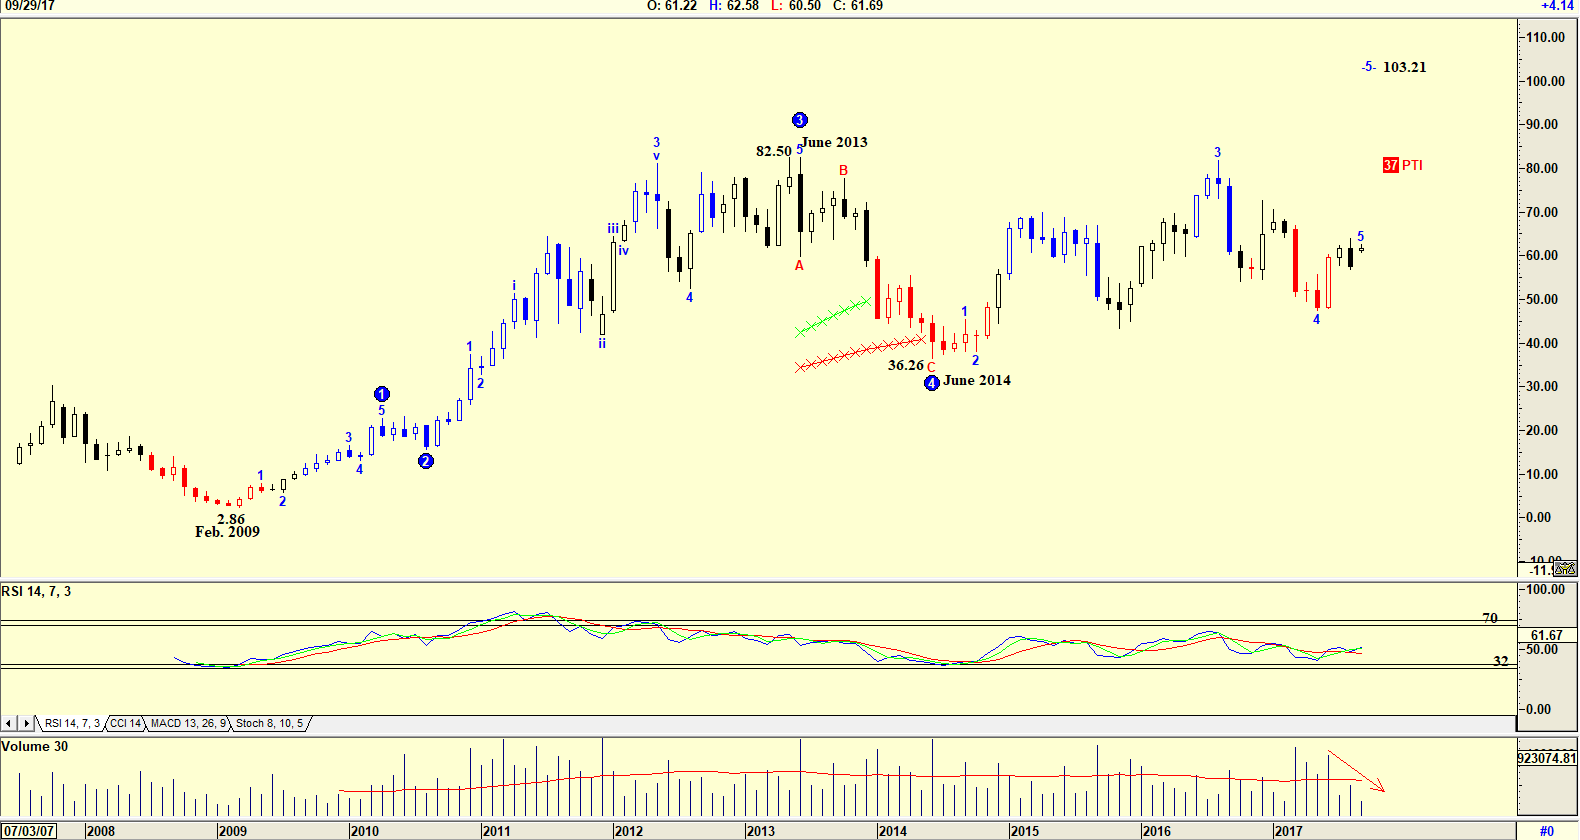
| Figure 1. Monthly chart with Elliott wave count. |
| Graphic provided by: AdvancedGET. |
| |
| The chart in Figure 1 is a monthly chart showing how the share price rose from $2.86 in February 2009 to a high of $82.50 by June 2013. From that high, the share price dropped to $36.26 by June 2014, and from that level has slowly been moving up in what the Elliott wave count suggests could be a WAVE 5 with a target of $103.21. The PTI (Probability Index) is 37 which is rather low. Do note the RSI Index which suggested a buy when the share price was $36.26 in June 2014. Since then the indicator has been moving sideways suggesting that the share price could indeed move to $103.21, however volume has fallen as the share price rose, suggesting weakness. |

|
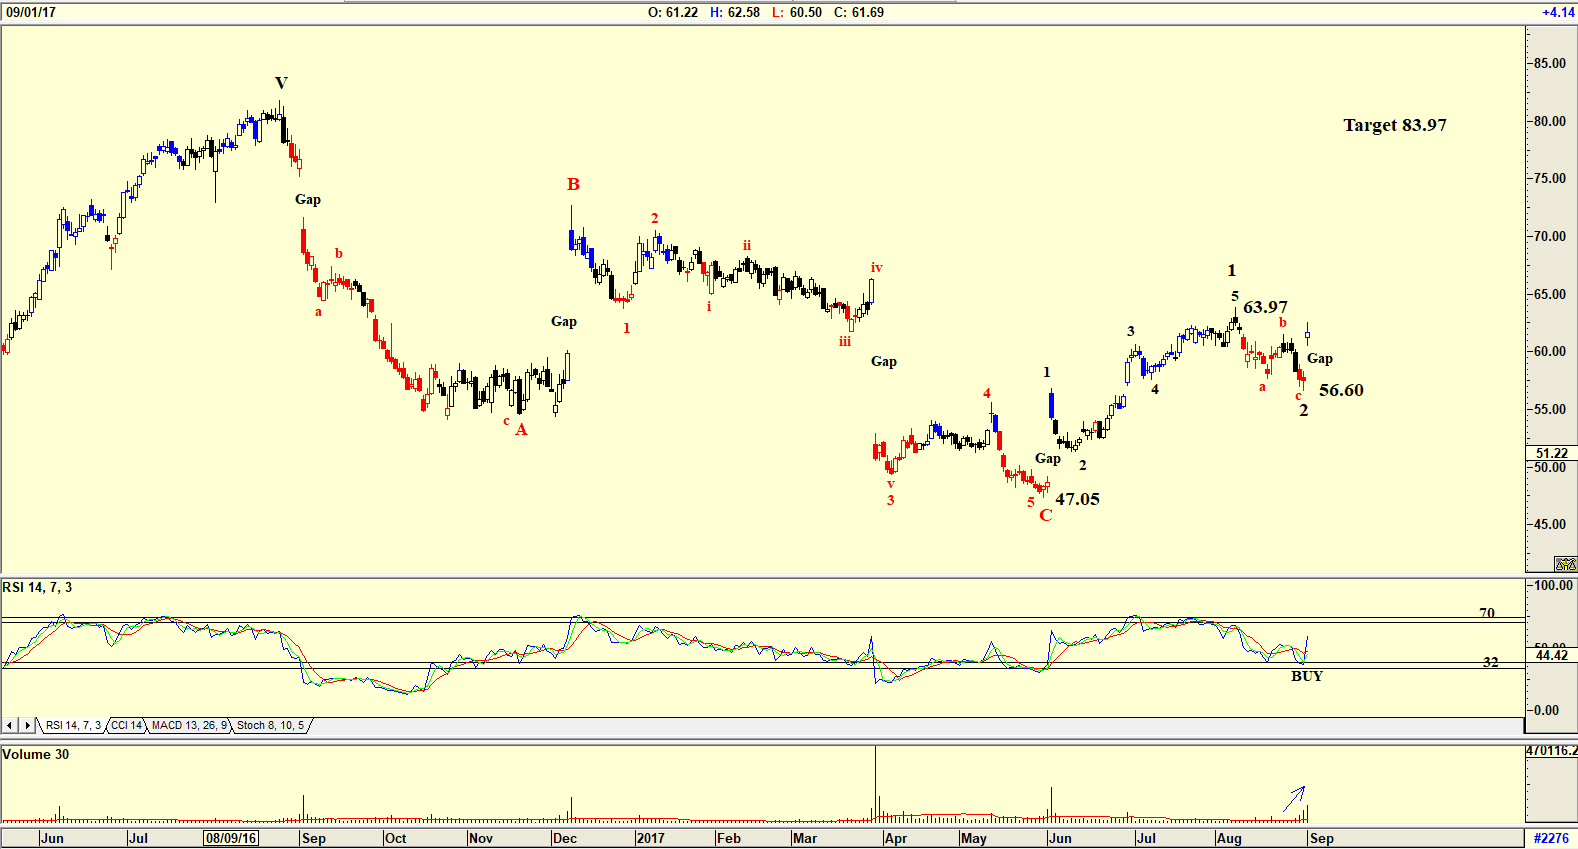
| Figure 2. Daily chart with Elliott wave count. |
| Graphic provided by: AdvancedGET. |
| |
| On Friday, September 1, the stock was up almost six per cent. "I am excited by the momentum in our business as we enter fall," Laurent Potdevinm, the chief executive told a conference call with analysts. "Lululemon is proof that a well-configured, focused brand can secure customer loyalty far better than a retailer selling a diffuse range of different products with little coherence." Do note on the chart how the share price always moved to fill a gap, suggesting that the price will fall sometime in the future to fill the latest gap. The RSI Indicator has given a buy. The Elliott wave count suggests that the share price could now move up in a Wave 3. Volume has strengthened as the share price rose suggesting strength. Lululemon is suggesting a buy with a wave 3 target of $83.97. The target is calculated as the Fibonacci figure 1.618 of Wave 1 (63.97-47.05=16.92 x 1.618 = 27.37 + 56.60 = 83.97.), however one should keep in mind that the share price could drop to fill the recent gap. |
Has been a technical analyst since 1969, and has worked as a futures and options trader with First Financial Futures in Johannesburg, South Africa.
| Address: | 3256 West 24th Ave |
| Vancouver, BC | |
| Phone # for sales: | 6042634214 |
| E-mail address: | petroosp@gmail.com |
Click here for more information about our publications!
Comments
Date: 09/27/17Rank: 4Comment:

Request Information From Our Sponsors
- StockCharts.com, Inc.
- Candle Patterns
- Candlestick Charting Explained
- Intermarket Technical Analysis
- John Murphy on Chart Analysis
- John Murphy's Chart Pattern Recognition
- John Murphy's Market Message
- MurphyExplainsMarketAnalysis-Intermarket Analysis
- MurphyExplainsMarketAnalysis-Visual Analysis
- StockCharts.com
- Technical Analysis of the Financial Markets
- The Visual Investor
- VectorVest, Inc.
- Executive Premier Workshop
- One-Day Options Course
- OptionsPro
- Retirement Income Workshop
- Sure-Fire Trading Systems (VectorVest, Inc.)
- Trading as a Business Workshop
- VectorVest 7 EOD
- VectorVest 7 RealTime/IntraDay
- VectorVest AutoTester
- VectorVest Educational Services
- VectorVest OnLine
- VectorVest Options Analyzer
- VectorVest ProGraphics v6.0
- VectorVest ProTrader 7
- VectorVest RealTime Derby Tool
- VectorVest Simulator
- VectorVest Variator
- VectorVest Watchdog
