HOT TOPICS LIST
- MACD
- Fibonacci
- RSI
- Gann
- ADXR
- Stochastics
- Volume
- Triangles
- Futures
- Cycles
- Volatility
- ZIGZAG
- MESA
- Retracement
- Aroon
INDICATORS LIST
LIST OF TOPICS
PRINT THIS ARTICLE
by Koos van der Merwe
With all that is happening in the White House today, one share to keep an eye on is Alibaba.
Position: Accumulate
Koos van der Merwe
Has been a technical analyst since 1969, and has worked as a futures and options trader with First Financial Futures in Johannesburg, South Africa.
PRINT THIS ARTICLE
TECHNICAL ANALYSIS
Alibaba - A Share To Watch
08/31/17 04:29:10 PMby Koos van der Merwe
With all that is happening in the White House today, one share to keep an eye on is Alibaba.
Position: Accumulate
| The company Alibaba was launched in 1999. It is a company founded in China by Jack Ma, a former English teacher from Hangzhou, China. The company was started by its founders to champion small businesses in the belief that the internet would level the playing field and would enable them to grow and compete more effectively in their domestic and global economies. Since the launch of its first website to help small Chinese exporters, manufacturers and entrepreneurs to sell internationally, the Alibaba Group has grown into a global leader in online and mobile commerce. |

|
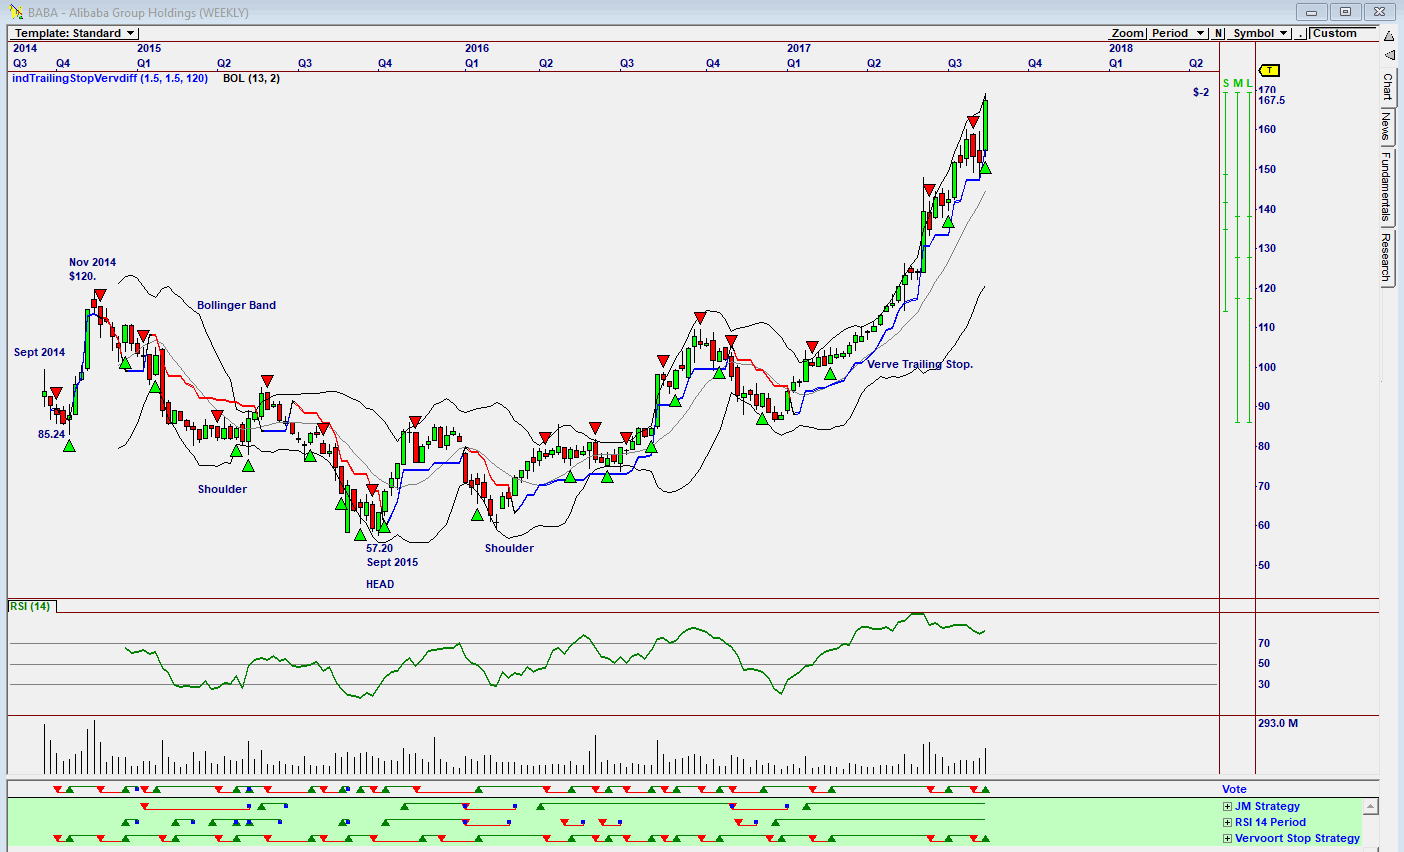
| Figure 1. Weekly Omnitrader Chart. |
| Graphic provided by: Omnitrader. |
| |
| The weekly chart in Figure 1 shows how the share has moved from its listing on the New York Stock Exchange in September 2014. By November 2014, after initially falling to a low of $85.24, the share price rose to a high of $120. From that high the share price fell to $57.20 by September 2015. From that low the share price started rising in an inverse Head and Shoulder formation. The program, Omnitrader, gave buy and sell signals on the Vote line that have been remarkably accurate. The Vote line presently suggests another buy signal even though the RSI-14 indicator shown on the chart is at overbought levels. |

|
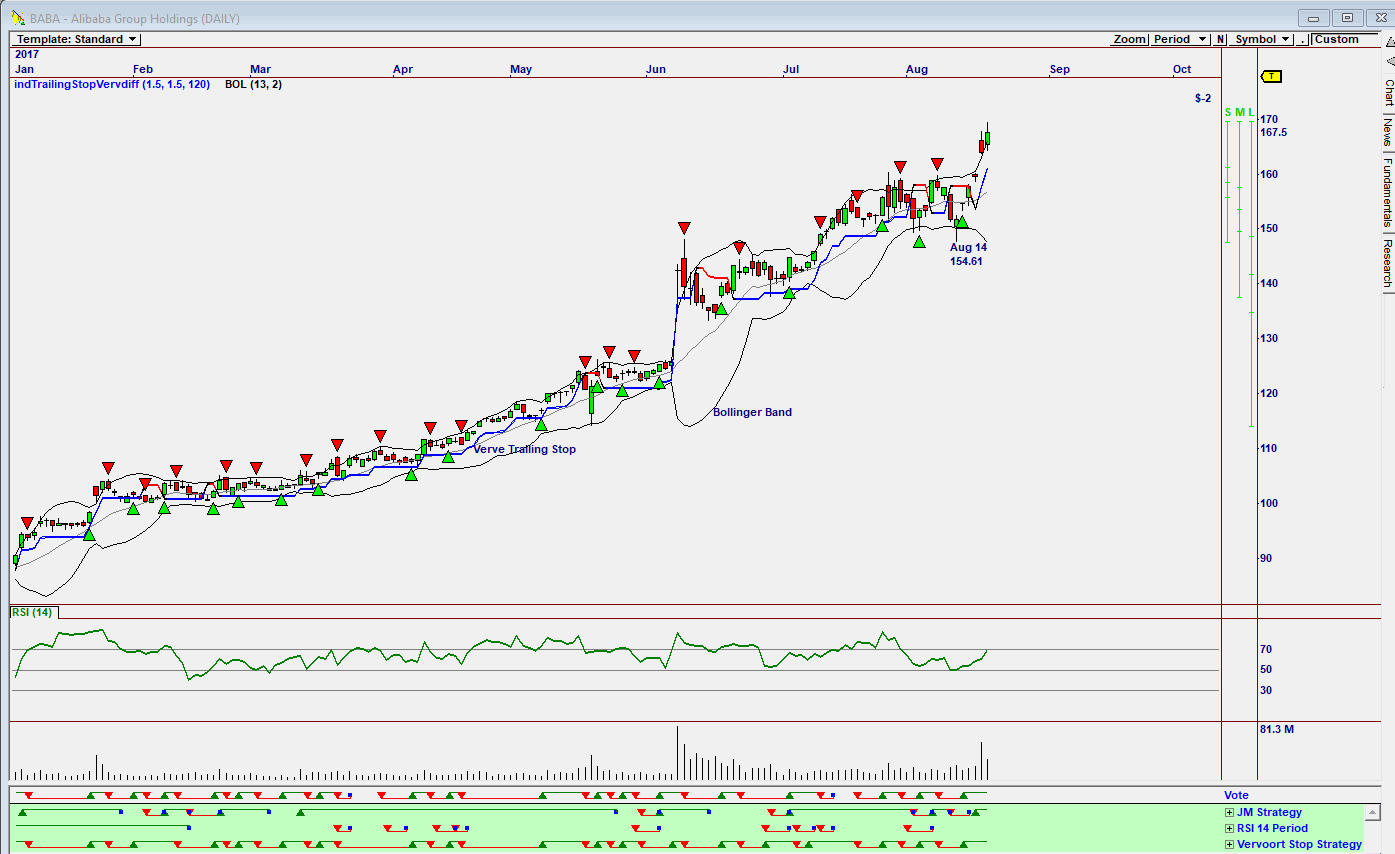
| Figure 2. Daily Omnitrader Chart. |
| Graphic provided by: Omnitrader. |
| |
| Looking at the daily Omnitrader chart, one can see how numerous buy/sell signals were given on the Vote line, based on the three strategies shown in green below the Vote line. The RSI Indicator moved between the 50 and 70 horizontal lines, suggesting numerous sell signals by rising above and the falling below the 70 horizontal line, but not suggesting a Buy signal by falling below and then rising above the 30 horizontal line. Do note volume over the past two days. The volume rose as the share price traded higher and then fell as the share price made a new high. A rising price on falling volume suggests weakness ahead. |

|
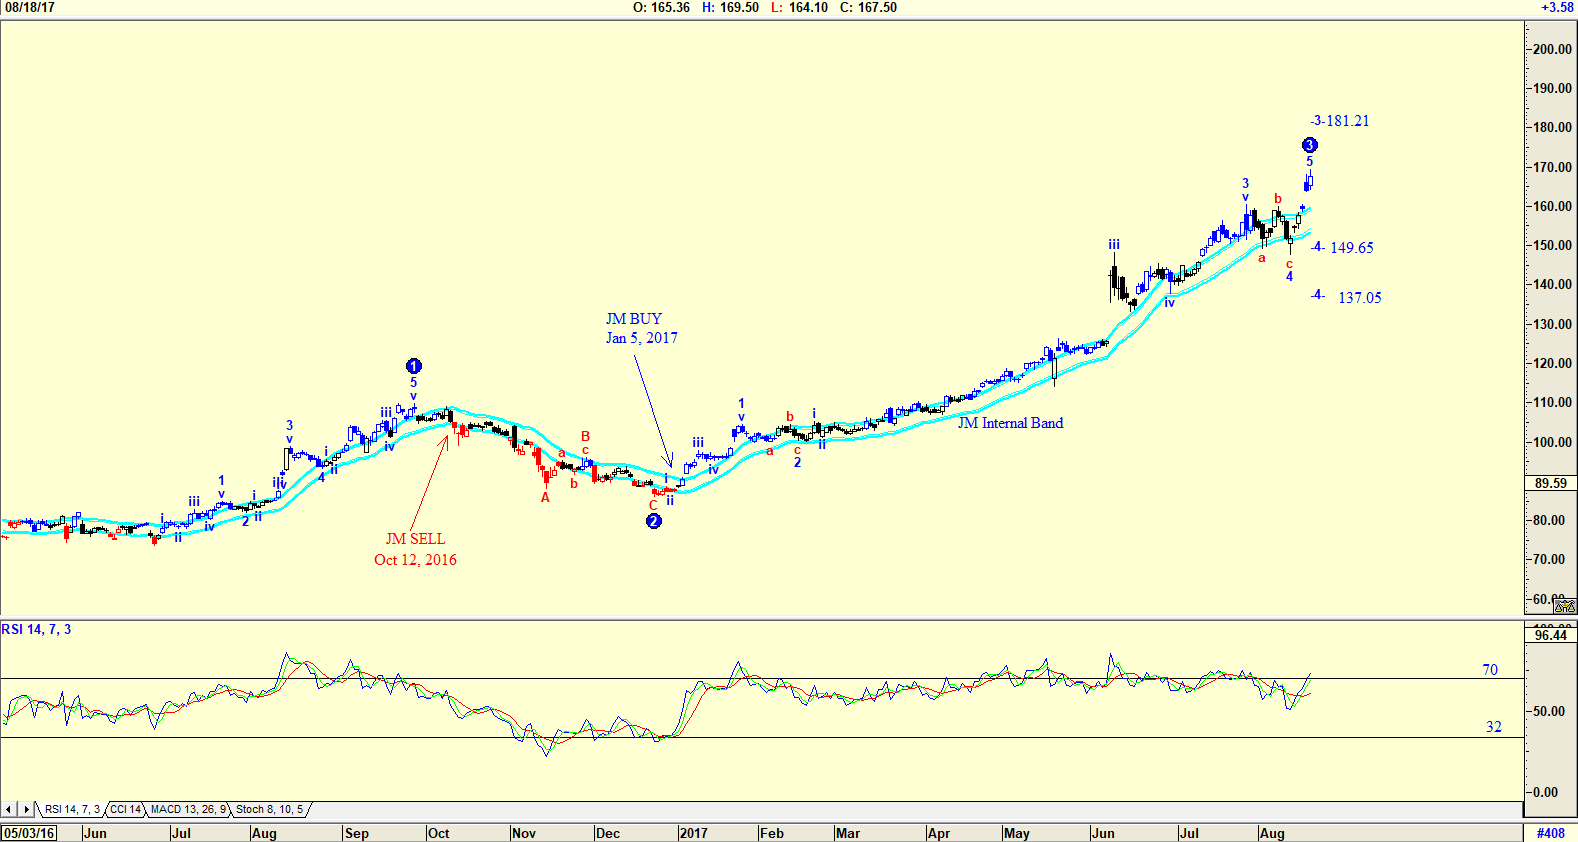
| Figure 3. Daily chart with Elliott wave count and JM Internal Band. |
| Graphic provided by: AdvancedGET. |
| |
| The chart in Figure 3 is a daily Advanced GET chart with an Elliott wave count suggesting that the share price is in a WAVE 3, and could fall in a WAVE 4 to either $149.65 or $137.05. The RSI indicator is at overbought levels, but although the indicator gave numerous sell signals previously, it has not given a new sell signal by falling below the 70-horizontal line. This does suggest that the share price could rise higher, topping out in a WAVE 3 at $181.21. Do note that the share price gave a JM Internal Band buy signal on January 5th, 2017. The JM Internal Band is a simple 15-period moving average offset by 2% positive and 2% negative. A move above the upper band suggests a buy and below the lower band, a sell, as shown on the chart. With the present uncertainty as more and more advisers to the President are leaving the White House, buying shares today could be risky. However, keeping an eye on shares one would like to own, and buying them as they bottom in a correction is something one should consider. Alibaba is a share that is a must on a watchlist. |
Has been a technical analyst since 1969, and has worked as a futures and options trader with First Financial Futures in Johannesburg, South Africa.
| Address: | 3256 West 24th Ave |
| Vancouver, BC | |
| Phone # for sales: | 6042634214 |
| E-mail address: | petroosp@gmail.com |
Click here for more information about our publications!
PRINT THIS ARTICLE

Request Information From Our Sponsors
- StockCharts.com, Inc.
- Candle Patterns
- Candlestick Charting Explained
- Intermarket Technical Analysis
- John Murphy on Chart Analysis
- John Murphy's Chart Pattern Recognition
- John Murphy's Market Message
- MurphyExplainsMarketAnalysis-Intermarket Analysis
- MurphyExplainsMarketAnalysis-Visual Analysis
- StockCharts.com
- Technical Analysis of the Financial Markets
- The Visual Investor
- VectorVest, Inc.
- Executive Premier Workshop
- One-Day Options Course
- OptionsPro
- Retirement Income Workshop
- Sure-Fire Trading Systems (VectorVest, Inc.)
- Trading as a Business Workshop
- VectorVest 7 EOD
- VectorVest 7 RealTime/IntraDay
- VectorVest AutoTester
- VectorVest Educational Services
- VectorVest OnLine
- VectorVest Options Analyzer
- VectorVest ProGraphics v6.0
- VectorVest ProTrader 7
- VectorVest RealTime Derby Tool
- VectorVest Simulator
- VectorVest Variator
- VectorVest Watchdog
