HOT TOPICS LIST
- MACD
- Fibonacci
- RSI
- Gann
- ADXR
- Stochastics
- Volume
- Triangles
- Futures
- Cycles
- Volatility
- ZIGZAG
- MESA
- Retracement
- Aroon
INDICATORS LIST
LIST OF TOPICS
PRINT THIS ARTICLE
by Gary Grosschadl
The Philadelphia Bank Index responded very well to a previous double bottom and is now looking to possibly repeat with its bearish counterpart - a double top.
Position: Sell
Gary Grosschadl
Independent Canadian equities trader and technical analyst based in Peterborough
Ontario, Canada.
PRINT THIS ARTICLE
DOUBLE TOPS
Double Top For Bank Index
12/09/02 11:03:51 AMby Gary Grosschadl
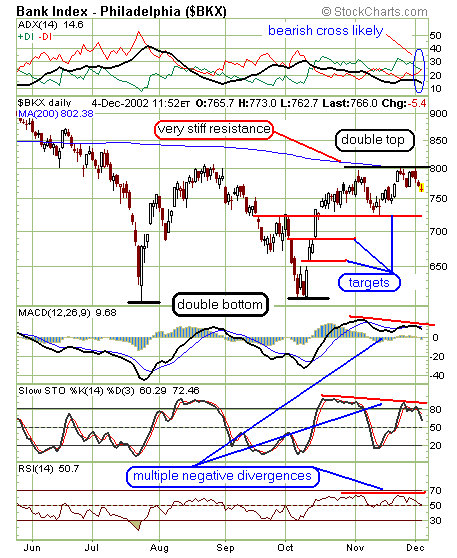
The Philadelphia Bank Index responded very well to a previous double bottom and is now looking to possibly repeat with its bearish counterpart - a double top.
Position: Sell
| After a dramatic rise (coinciding with the overall markets) this index looks too tired to break past the 200-day moving average. This, of course, is a pattern that is being repeated with other high profile stocks and the main indices as well. The chart shows a likely double top formation with three target or resistance areas. These resistance areas coincide with previous gaps (gaps often act as support/resistance) and possible candle support (bottoms of large candles often act as support). |
| The first target/support at 725 is the trough area of the double top. If this does not hold then the next two areas of support may come into play. The measurement from the trough to the top of the double top is 75 points. This becomes the downside measure taken from the trough bottom, which comes in around 650, as the implied downside target for this double top. This is close to my lower indicated target of 660, which does not mean it will go down that far, but it can. |

|
| Graphic provided by: StockCharts.com. |
| |
| The directional movement indicator ADX/DI above the price chart shows a potential bearish cross which could foster the bears gaining the upper hand should -DI cross to the topside. As with other bearish charts that I comment on, we see the familiar scene of multiple negative divergences to price action. This is often a timely and potent signal. |
| Since the bank index is one of the mainstays of the marketplace, it bears monitoring as it often provides valuable clues to the overall health of the main indices. Right now things are pointing downhill. |
Independent Canadian equities trader and technical analyst based in Peterborough
Ontario, Canada.
| Website: | www.whatsonsale.ca/financial.html |
| E-mail address: | gwg7@sympatico.ca |
Click here for more information about our publications!
Comments
Date: 12/10/02Rank: 4Comment:

Request Information From Our Sponsors
- StockCharts.com, Inc.
- Candle Patterns
- Candlestick Charting Explained
- Intermarket Technical Analysis
- John Murphy on Chart Analysis
- John Murphy's Chart Pattern Recognition
- John Murphy's Market Message
- MurphyExplainsMarketAnalysis-Intermarket Analysis
- MurphyExplainsMarketAnalysis-Visual Analysis
- StockCharts.com
- Technical Analysis of the Financial Markets
- The Visual Investor
- VectorVest, Inc.
- Executive Premier Workshop
- One-Day Options Course
- OptionsPro
- Retirement Income Workshop
- Sure-Fire Trading Systems (VectorVest, Inc.)
- Trading as a Business Workshop
- VectorVest 7 EOD
- VectorVest 7 RealTime/IntraDay
- VectorVest AutoTester
- VectorVest Educational Services
- VectorVest OnLine
- VectorVest Options Analyzer
- VectorVest ProGraphics v6.0
- VectorVest ProTrader 7
- VectorVest RealTime Derby Tool
- VectorVest Simulator
- VectorVest Variator
- VectorVest Watchdog
