HOT TOPICS LIST
- MACD
- Fibonacci
- RSI
- Gann
- ADXR
- Stochastics
- Volume
- Triangles
- Futures
- Cycles
- Volatility
- ZIGZAG
- MESA
- Retracement
- Aroon
INDICATORS LIST
LIST OF TOPICS
PRINT THIS ARTICLE
by Koos van der Merwe
Many well-known analysts have been calling for a correction. Is this the start of the correction?
Position: Hold
Koos van der Merwe
Has been a technical analyst since 1969, and has worked as a futures and options trader with First Financial Futures in Johannesburg, South Africa.
PRINT THIS ARTICLE
ELLIOTT WAVE
Is This The Start Of The Correction?
08/31/17 04:21:47 PMby Koos van der Merwe
Many well-known analysts have been calling for a correction. Is this the start of the correction?
Position: Hold
| The most recent analyst, name not mentioned, has stated that a 10% correction in the market is due. This will be followed by a move up, and then in 2019 there will be a major market collapse. With the present political events hitting the world, events that could lead to a nuclear war between North Korea and the United States of America, this correction could truly happen. Personally, I believe that should President Trump decide to bomb North Korea, it will not be nuclear. President Trump is certainly not threatening nuclear war. It is Kim Jong Un that is doing that, with threats against Guam, a Pacific island with extensive American air and naval bases on it. Trump and Mattis are speaking of massive carpet-bombing and precise targeting of conventional missiles and smart bombs on a scale that would eliminate every military target in North Korea with, hopefully, minor collateral damage to the civilian population. The threat of this attack will cause the indexes to fall approximately 10% as expected. It is only a real attack that I believe will cause a market collapse. |

|
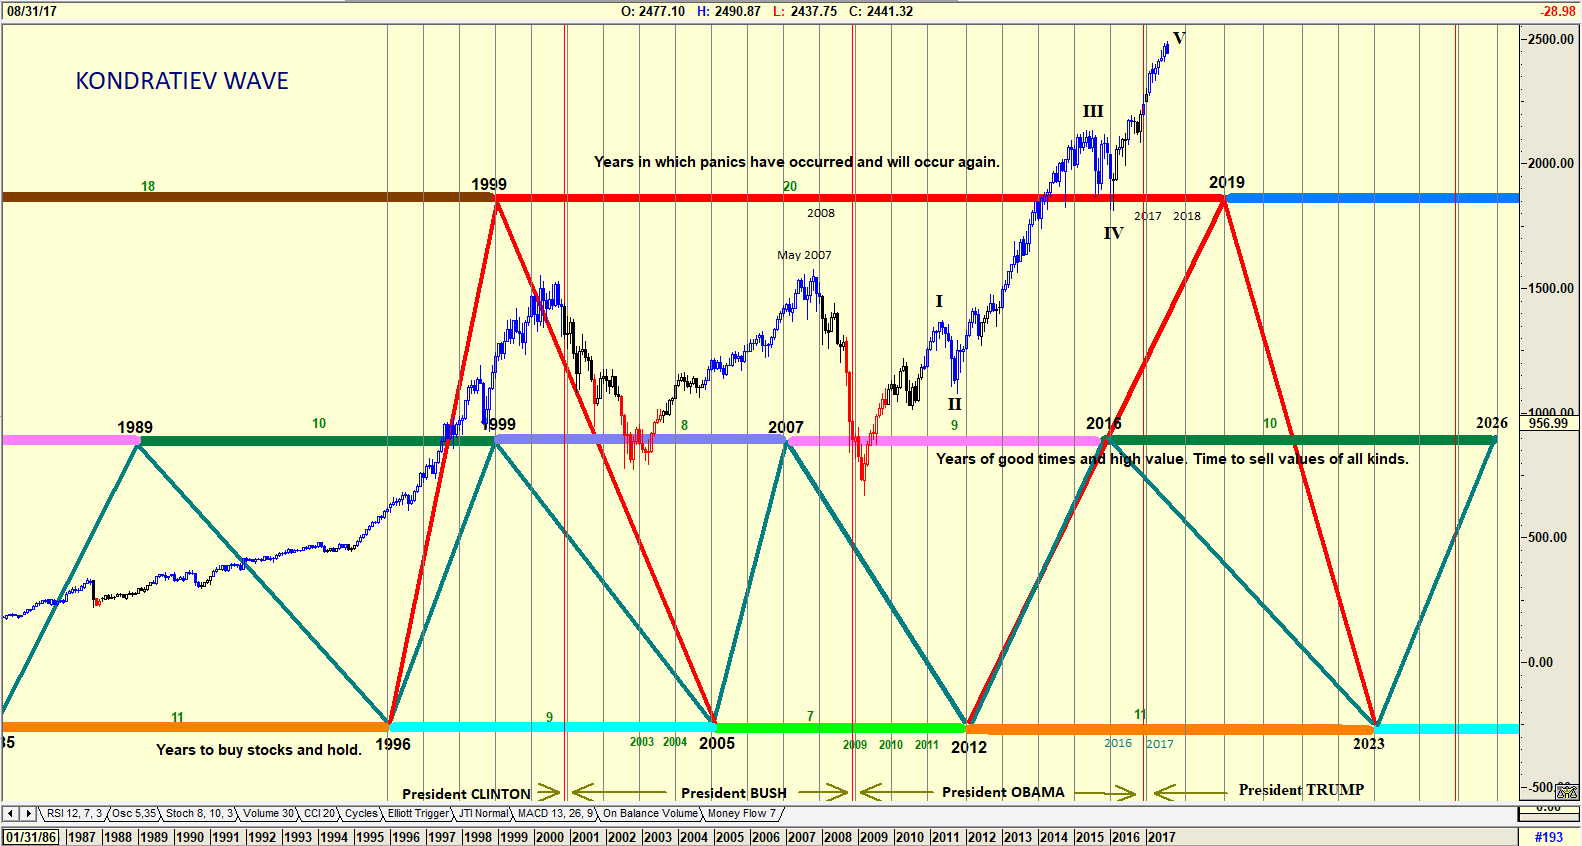
| Figure 1. Dow Jones on the Kondratiev Wave. |
| Graphic provided by: AdvancedGET. |
| |
| The chart in Figure 1 is a chart of the Down Jones drawn on the Kondratiev wave that suggests a major market collapse in 2019. The 2016 correction could have already occurred being the WAVE III - WAVE IV as shown on the chart. Allowing for a margin of error this could be wrong, and an approximately 10% correction could occur at any time now. This would be the Elliott WAVE A down, followed by a WAVE B up which is then followed by a major collapse in a WAVE C. |

|
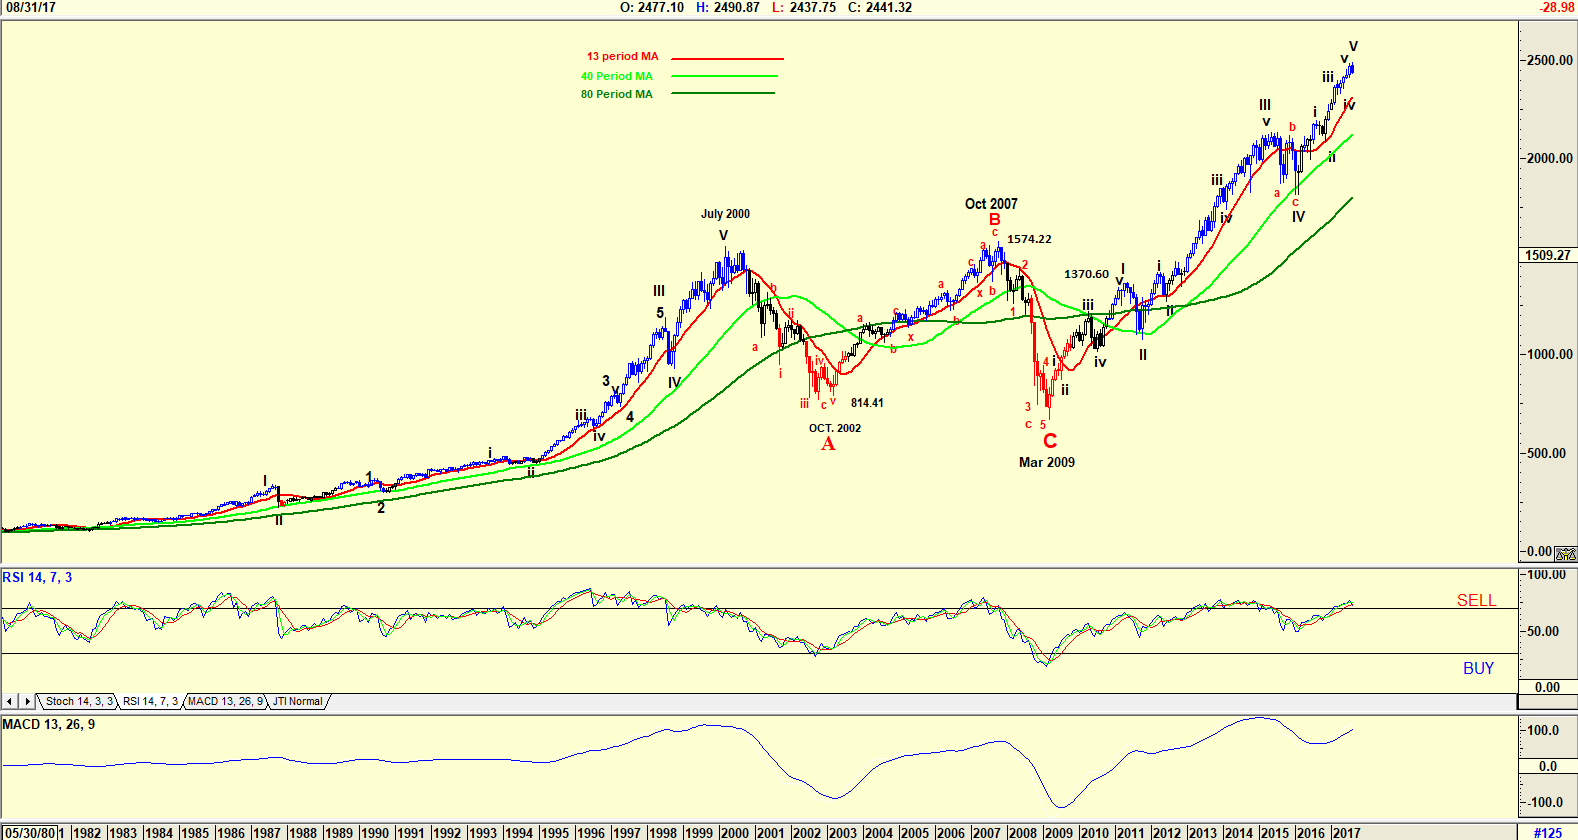
| Figure 2. Monthly Chart of the S&P 500 Index. |
| Graphic provided by: AdvancedGET. |
| |
| The chart in Figure 2 is a monthly chart of the S&P 500 Index, with an Elliott wave count suggesting that the index is completing a major WAVE V. The RSI Index is at overbought levels, but has not yet given a sell signal. The MACD indicator has also not given a sell signal, but both indicators are suggesting that one could be given soon. |

|
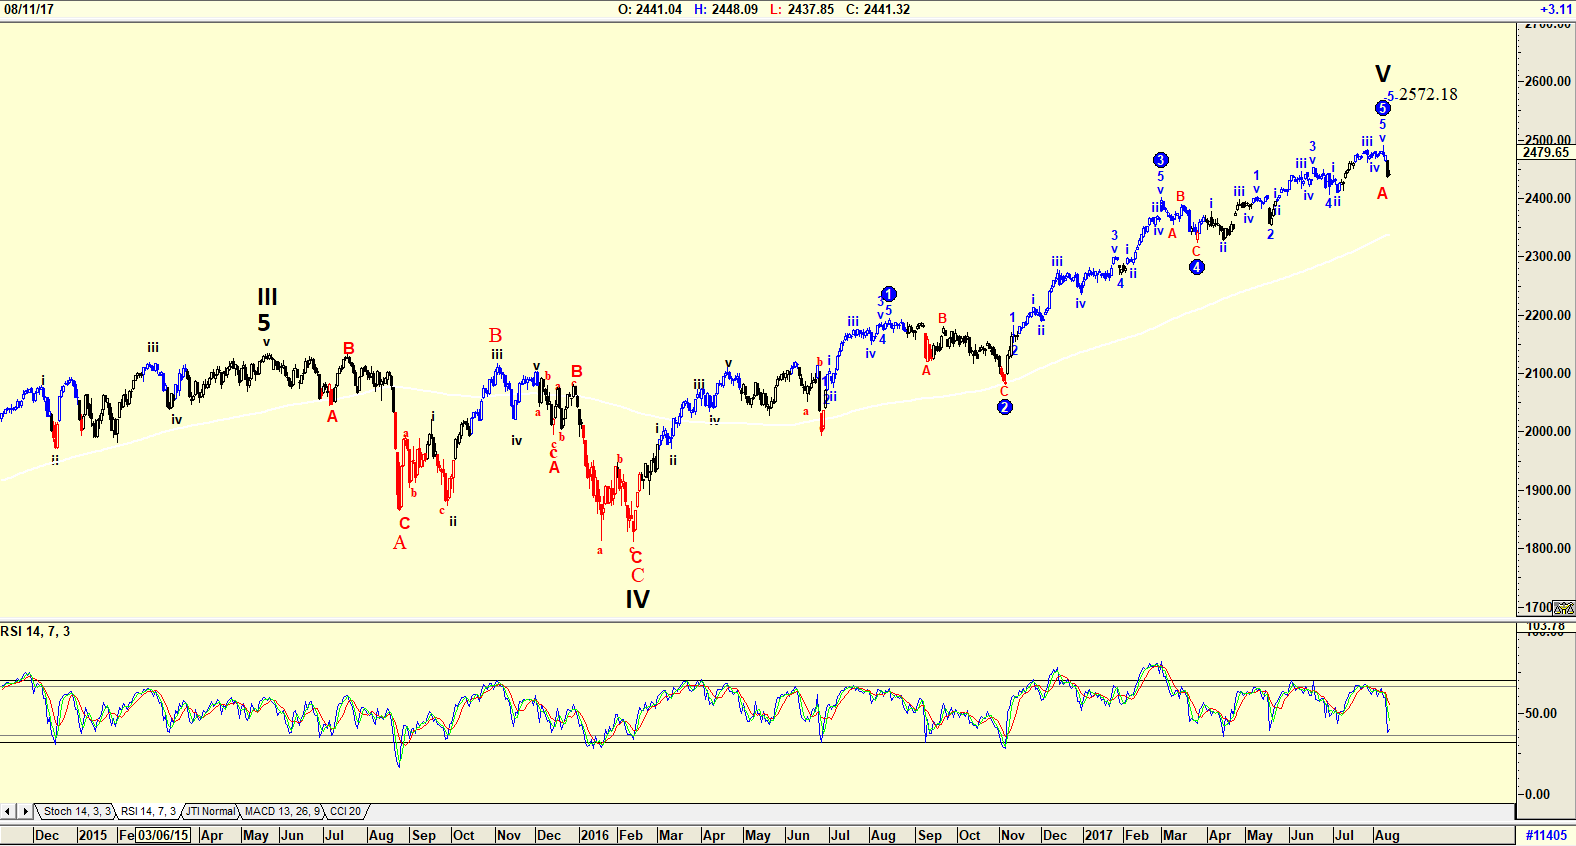
| Figure 3. Daily chart of the S&P 500 Index. |
| Graphic provided by: AdvancedGET. |
| |
| The daily chart of the S&P 500 Index does suggest that a WAVE V could still rise to 2572.18 before falling in a WAVE A correction. The RSI indicator is approaching oversold levels, and could possibly suggest a buy in the near future. However, should this occur, it will be a minor wave B up with a wave C down to follow completing a major WAVE A correction. |

|
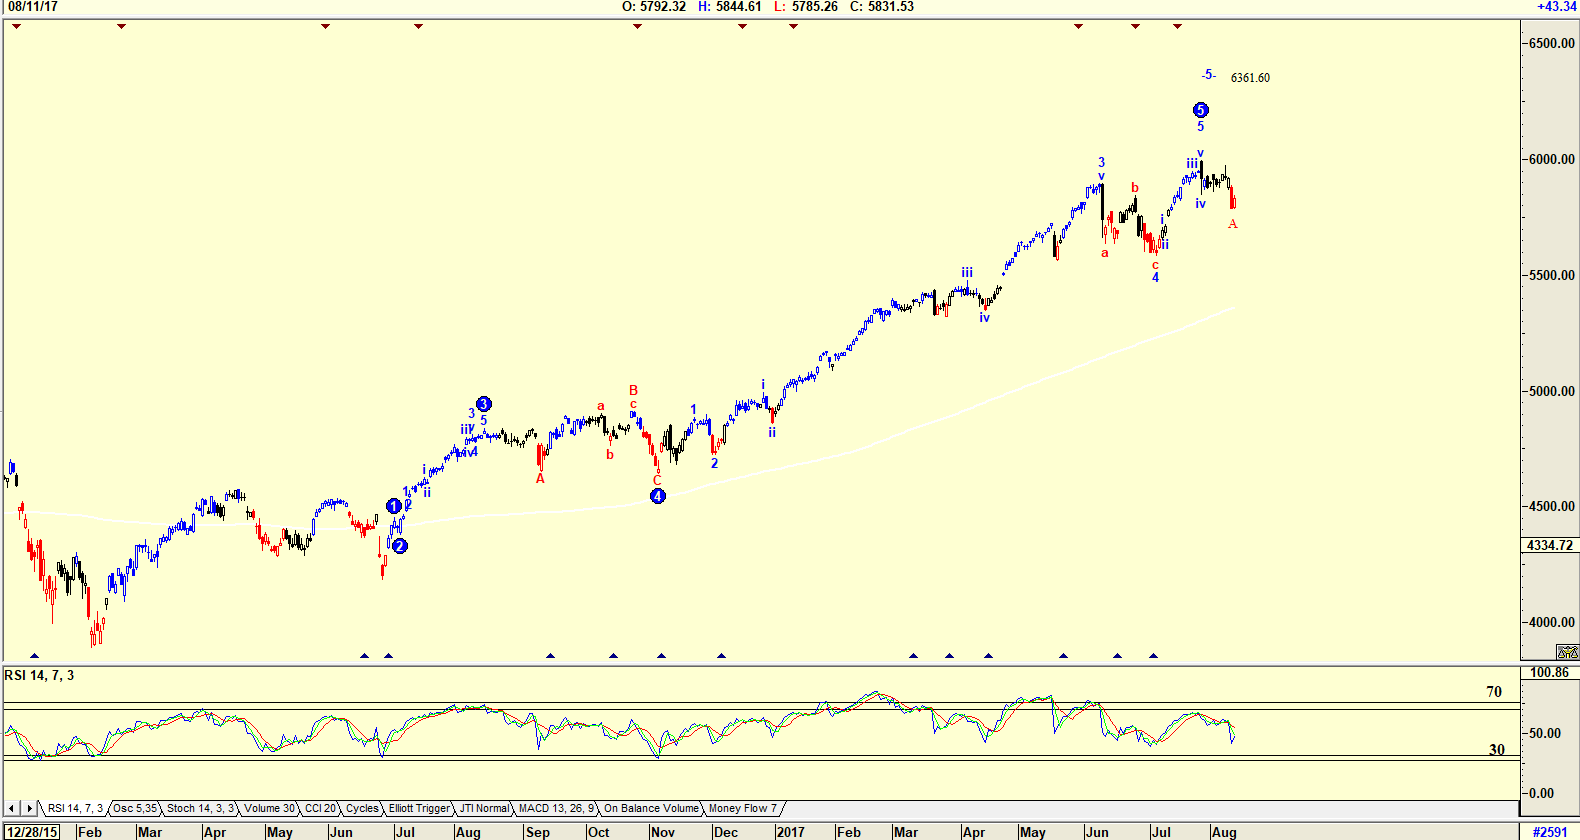
| Figure 4. Daily chart of the Nasdaq Index. |
| Graphic provided by: AdvancedGET. |
| |
| A look at a daily chart of the Nasdaq Index gives a similar Elliott wave count suggesting that the index could be in a minor wave A down which will be followed by a wave B up then a wave C down completing a major WAVE A correction. The chart does suggest that the index could rise to 6361.60. The RSI Index is still falling and has not yet broken below the 30-horizontal level completing its sell signal. With all the bad news hitting the world... With North Korea threatening a nuclear attack on GUAM and the USA... With President Donald Trump reacting with words of "Fire and Fury", sophisticated investors are running to the side of caution. Yes, a major correction is due as suggested by the Elliott wave counts on the K-Wave and the major indexes. Whether it will occur tomorrow or next year, is anybody's guess, but the word of the day, a word that should be closely followed is CAUTION. Always leave the last 10% to the risk taker. |
Has been a technical analyst since 1969, and has worked as a futures and options trader with First Financial Futures in Johannesburg, South Africa.
| Address: | 3256 West 24th Ave |
| Vancouver, BC | |
| Phone # for sales: | 6042634214 |
| E-mail address: | petroosp@gmail.com |
Click here for more information about our publications!
Comments
Date: 09/03/17Rank: 5Comment:
Date: 10/14/17Rank: 5Comment:

Request Information From Our Sponsors
- StockCharts.com, Inc.
- Candle Patterns
- Candlestick Charting Explained
- Intermarket Technical Analysis
- John Murphy on Chart Analysis
- John Murphy's Chart Pattern Recognition
- John Murphy's Market Message
- MurphyExplainsMarketAnalysis-Intermarket Analysis
- MurphyExplainsMarketAnalysis-Visual Analysis
- StockCharts.com
- Technical Analysis of the Financial Markets
- The Visual Investor
- VectorVest, Inc.
- Executive Premier Workshop
- One-Day Options Course
- OptionsPro
- Retirement Income Workshop
- Sure-Fire Trading Systems (VectorVest, Inc.)
- Trading as a Business Workshop
- VectorVest 7 EOD
- VectorVest 7 RealTime/IntraDay
- VectorVest AutoTester
- VectorVest Educational Services
- VectorVest OnLine
- VectorVest Options Analyzer
- VectorVest ProGraphics v6.0
- VectorVest ProTrader 7
- VectorVest RealTime Derby Tool
- VectorVest Simulator
- VectorVest Variator
- VectorVest Watchdog
