HOT TOPICS LIST
- MACD
- Fibonacci
- RSI
- Gann
- ADXR
- Stochastics
- Volume
- Triangles
- Futures
- Cycles
- Volatility
- ZIGZAG
- MESA
- Retracement
- Aroon
INDICATORS LIST
LIST OF TOPICS
PRINT THIS ARTICLE
by Koos van der Merwe
Andarko Petroleum has declared a dividend. Is it worth a buy?
Position: Buy
Koos van der Merwe
Has been a technical analyst since 1969, and has worked as a futures and options trader with First Financial Futures in Johannesburg, South Africa.
PRINT THIS ARTICLE
DIVIDEND YIELD
Playing The Dividend Game
08/23/17 04:32:23 PMby Koos van der Merwe
Andarko Petroleum has declared a dividend. Is it worth a buy?
Position: Buy
| Andarko Petroleum is an American petroleum and natural gas exploration and production company headquartered in Texas. On August 2 the company declared a quarterly cash dividend on the company's common stock of 5 cents per share, payable September 27, 2017, to stockholders of record at the close of business on September 13, 2017. Those traders who play the "dividend game", buy shares of a company before closure and then will sell the share the day after closure, September 13. On the other hand, there are also traders who will ride the share up and sell the share one or two days before September 13. To what extent the movement of the oil price will affect the share price must also be taken into consideration. On August 3, the company mourned the loss of a member of their Board of Directors, a man who earned the Order of Canada in 2007 for his leadership in the development of Canada's natural resource sector. |

|
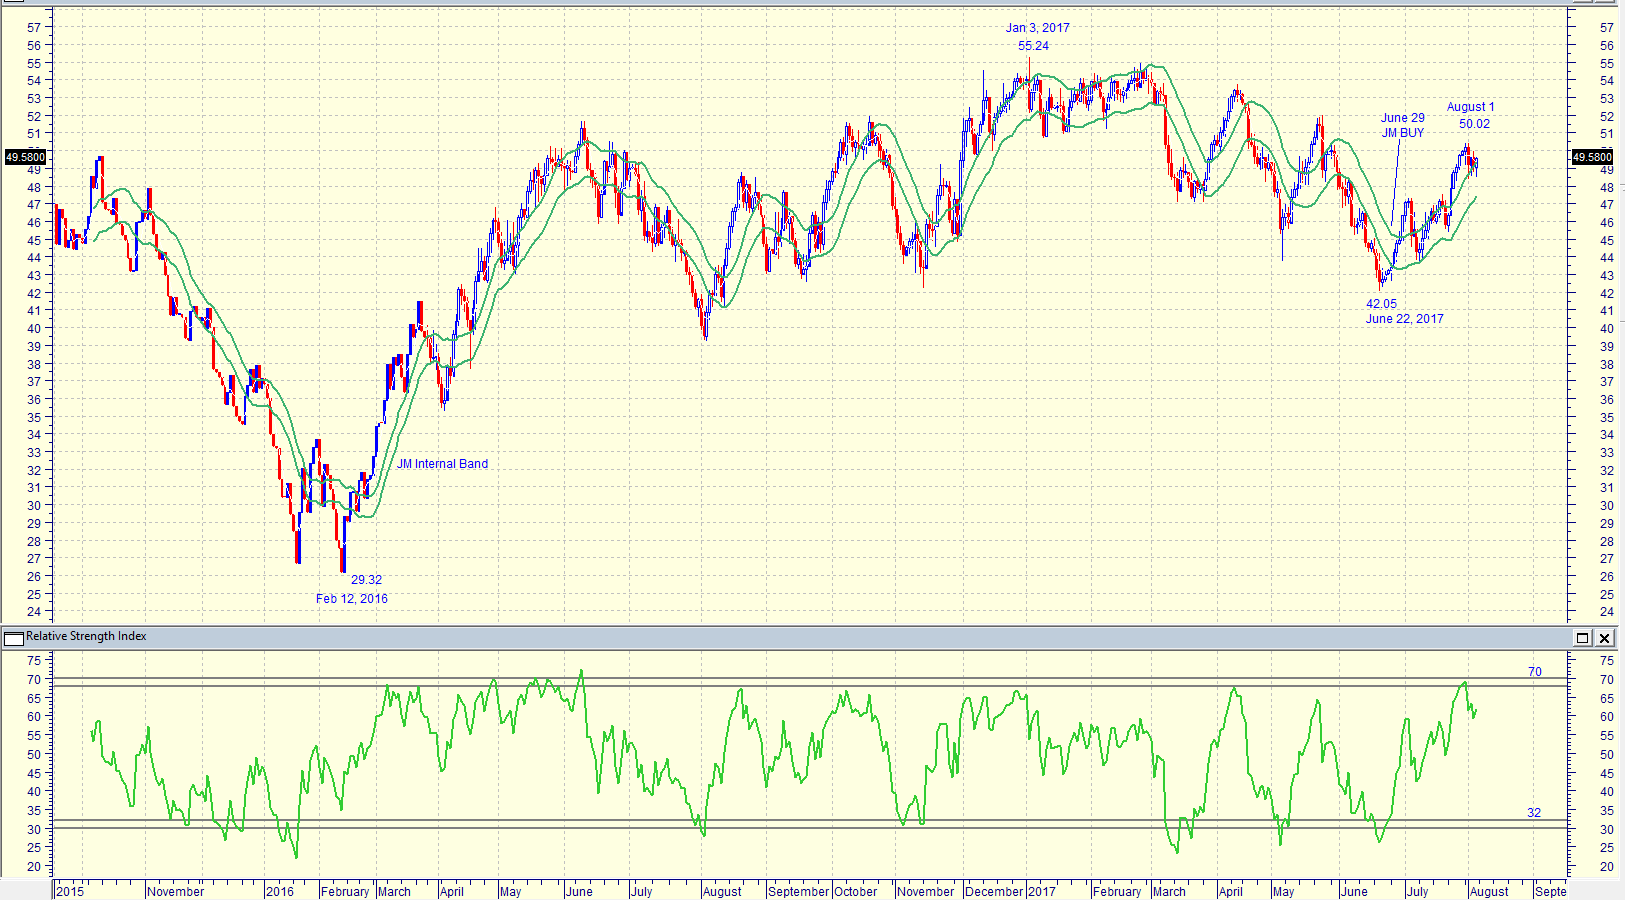
| Figure 1. Crude Oil WTI Futures. |
| Graphic provided by: MetaStock. |
| |
| The chart in Figure 1 is a daily chart of the Crude Oil WTI Futures data. The chart shows how the price rose from a low of $29.32 on February 12, 2016, to a high of $55.24 by January 3, 2017. From that high the price fell to $42.05 in June 22, 2017. With a buy signal given on the JM Internal Band on June 29, 2017, the price has risen to $50.02 by August 1. The JM Internal Band is a simple 15-period moving average offset by 2% positive and 2% negative. A move above the upper band suggests a buy, and below the lower band a sell. The RSI has suggested a sell signal, and the price has fallen to its present price of $49.58. The price could fall lower as suggested by a falling RSI indicator. Looking back on the chart however does show that the RSI indicator could rise above the 70 horizontal line again before a sell signal is confirmed. |

|
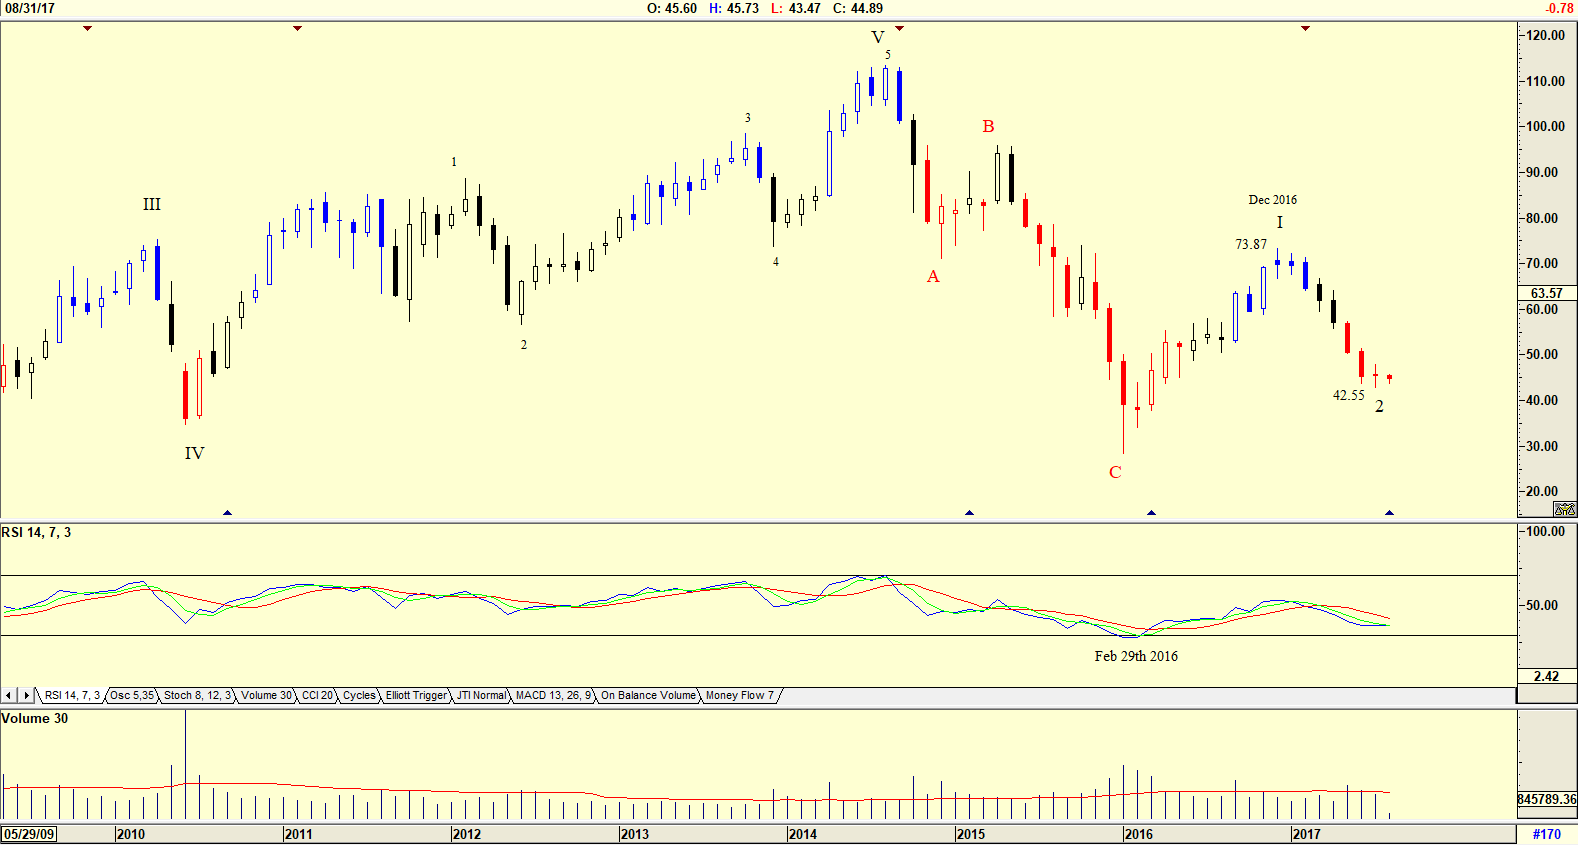
| Figure 2. Monthly chart of Andarko Petroleum. |
| Graphic provided by: AdvancedGET. |
| |
| The chart in Figure 2 is a monthly chart of Andarko Petroleum that is suggesting the share price is completing an Elliott wave 2. The RSI Indicator gave a buy signal on February 29, 2016. The price rose in a WAVE 1 to $73.87 by December 2016 and has since fallen in a Wave 2 to $42.55. Do note how volume has fallen the past 3 months as the share price fell, suggesting strength. With the RSI possibly rising, the share price could now start rising. |

|
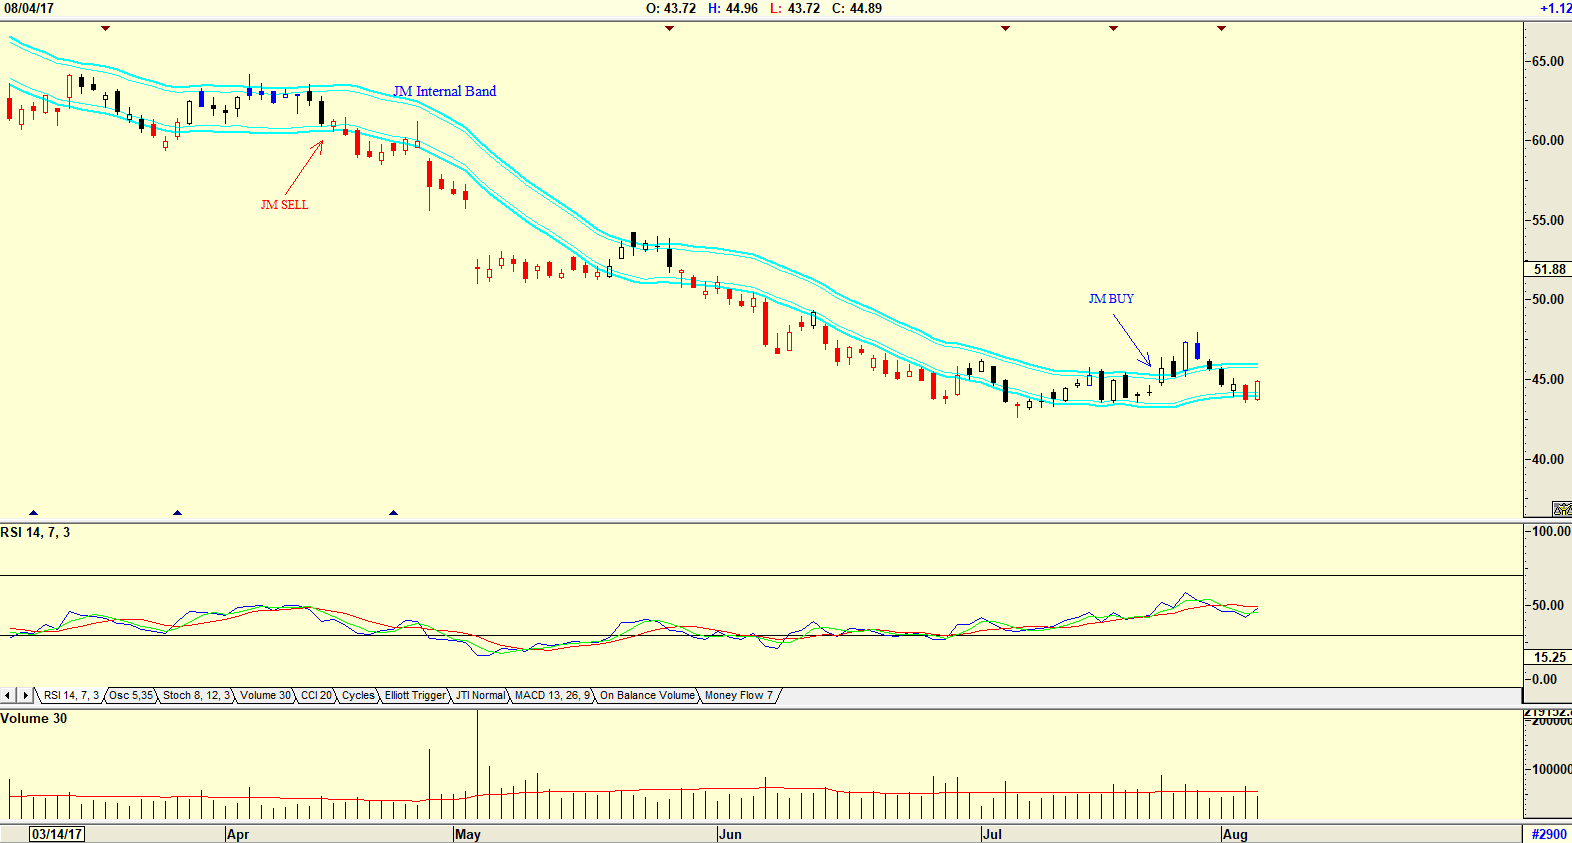
| Figure 3. Daily chart of Andarko Petroleum. |
| Graphic provided by: AdvancedGET. |
| |
| The chart in Figure 3 is a daily chart showing how the share price is flirting with the lower JM Internal Band. The share did not give a sell signal. The RSI indicator is trending upwards suggesting that share price should rise. |

|
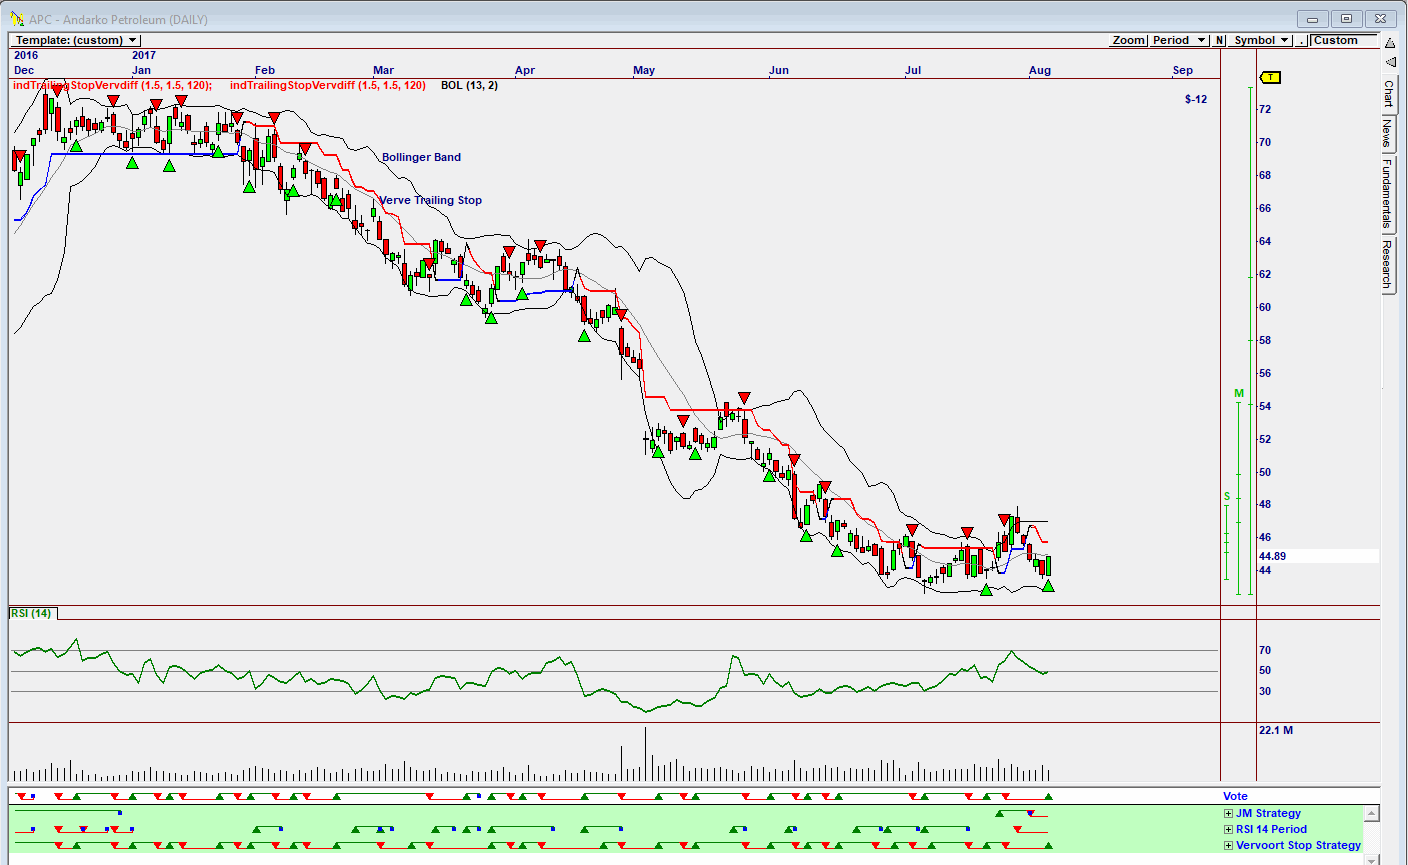
| Figure 4. Daily Omnitrader chart showing a buy on the Vote line. |
| Graphic provided by: Omnitrader. |
| |
| The chart in Figure 4 is a daily Omnitrader chart showing a buy signal on the Vote line, triggered by the Vervoort Stop Strategy. Both the RSI 14-Period and the JM Strategy are still negative but they did not influence the Vote line. Playing the dividend game, ie buying the share price when a dividend is announced and selling the share a day before the dividend is declared, and scoring on capital growth, is a game played by many. However, like all gambles, it could have its failures. The chart of Andarko Petroleum does suggest that the share price could rise, so the gamble here could be profitable. |
Has been a technical analyst since 1969, and has worked as a futures and options trader with First Financial Futures in Johannesburg, South Africa.
| Address: | 3256 West 24th Ave |
| Vancouver, BC | |
| Phone # for sales: | 6042634214 |
| E-mail address: | petroosp@gmail.com |
Click here for more information about our publications!
Comments

Request Information From Our Sponsors
- StockCharts.com, Inc.
- Candle Patterns
- Candlestick Charting Explained
- Intermarket Technical Analysis
- John Murphy on Chart Analysis
- John Murphy's Chart Pattern Recognition
- John Murphy's Market Message
- MurphyExplainsMarketAnalysis-Intermarket Analysis
- MurphyExplainsMarketAnalysis-Visual Analysis
- StockCharts.com
- Technical Analysis of the Financial Markets
- The Visual Investor
- VectorVest, Inc.
- Executive Premier Workshop
- One-Day Options Course
- OptionsPro
- Retirement Income Workshop
- Sure-Fire Trading Systems (VectorVest, Inc.)
- Trading as a Business Workshop
- VectorVest 7 EOD
- VectorVest 7 RealTime/IntraDay
- VectorVest AutoTester
- VectorVest Educational Services
- VectorVest OnLine
- VectorVest Options Analyzer
- VectorVest ProGraphics v6.0
- VectorVest ProTrader 7
- VectorVest RealTime Derby Tool
- VectorVest Simulator
- VectorVest Variator
- VectorVest Watchdog
