HOT TOPICS LIST
- MACD
- Fibonacci
- RSI
- Gann
- ADXR
- Stochastics
- Volume
- Triangles
- Futures
- Cycles
- Volatility
- ZIGZAG
- MESA
- Retracement
- Aroon
INDICATORS LIST
LIST OF TOPICS
PRINT THIS ARTICLE
by Koos van der Merwe
The share price of Boeing rose nearly 10% to a record high on Wednesday, July 26.
Position: Sell
Koos van der Merwe
Has been a technical analyst since 1969, and has worked as a futures and options trader with First Financial Futures in Johannesburg, South Africa.
PRINT THIS ARTICLE
ELLIOTT WAVE
A Look At Boeing
08/23/17 03:59:08 PMby Koos van der Merwe
The share price of Boeing rose nearly 10% to a record high on Wednesday, July 26.
Position: Sell
| Boeing recorded a net profit of $1.76 billion on earnings during the second quarter. During the same period a year ago, the company showed a loss of $234 million. Reading news about the company, and what its plans are for the future is a must, however charts are looking troublesome. |

|
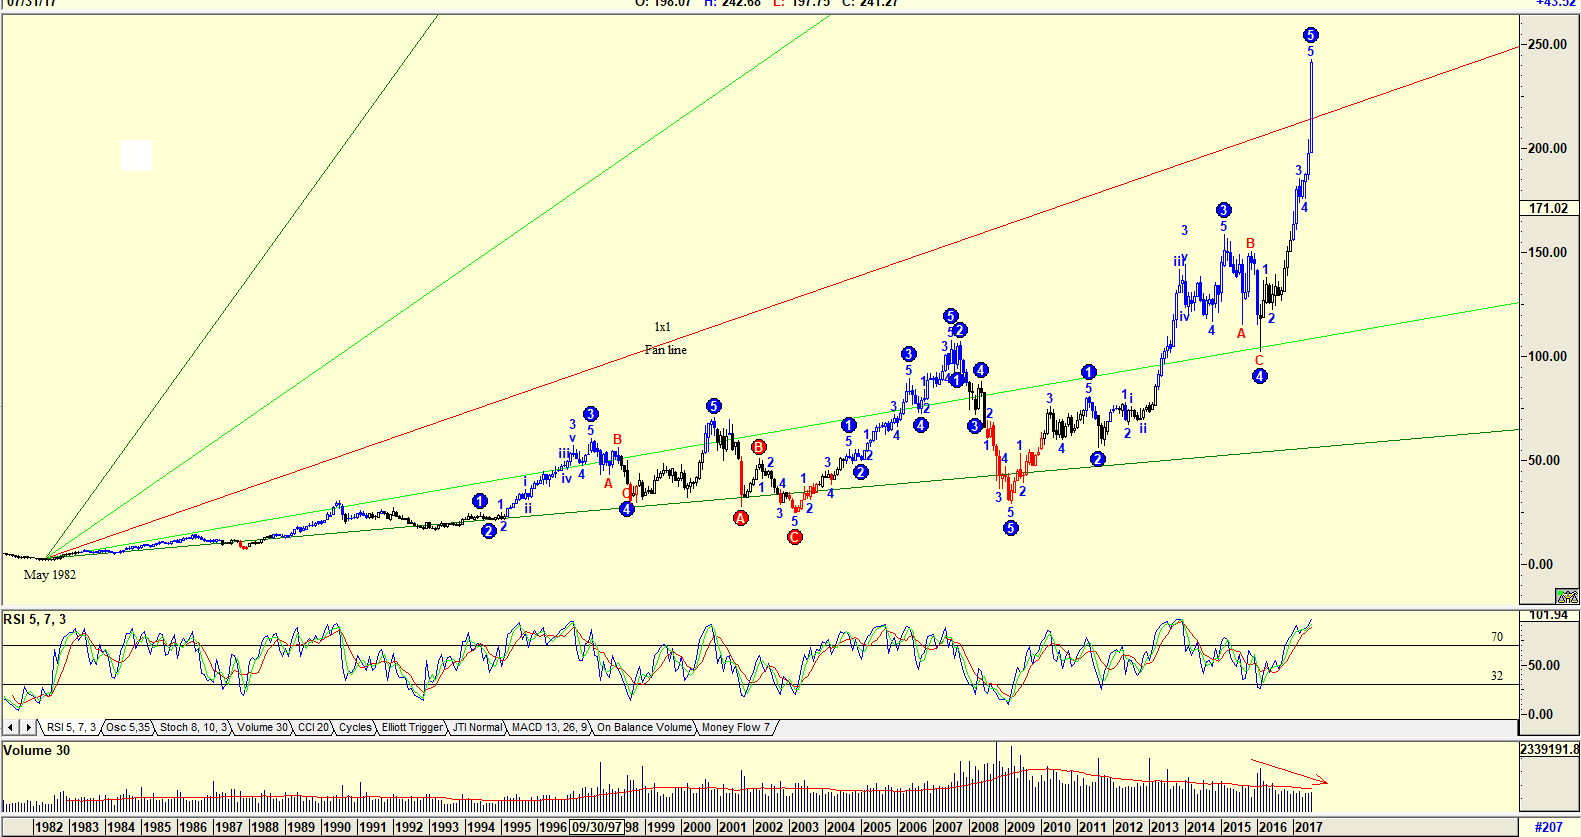
| Figure 1. Monthly chart with Elliott wave count and Gann fan. |
| Graphic provided by: AdvancedGET. |
| |
| The chart in Figure 1 is a monthly chart with an Elliott wave count suggesting that the share price is completing a major WAVE 5. With a Gann fan drawn from May 1982, and the share price breaking above the 1x1 fan line and with volume dropping and the RSI indicator at overbought levels, a correction could occur in the near future. |

|
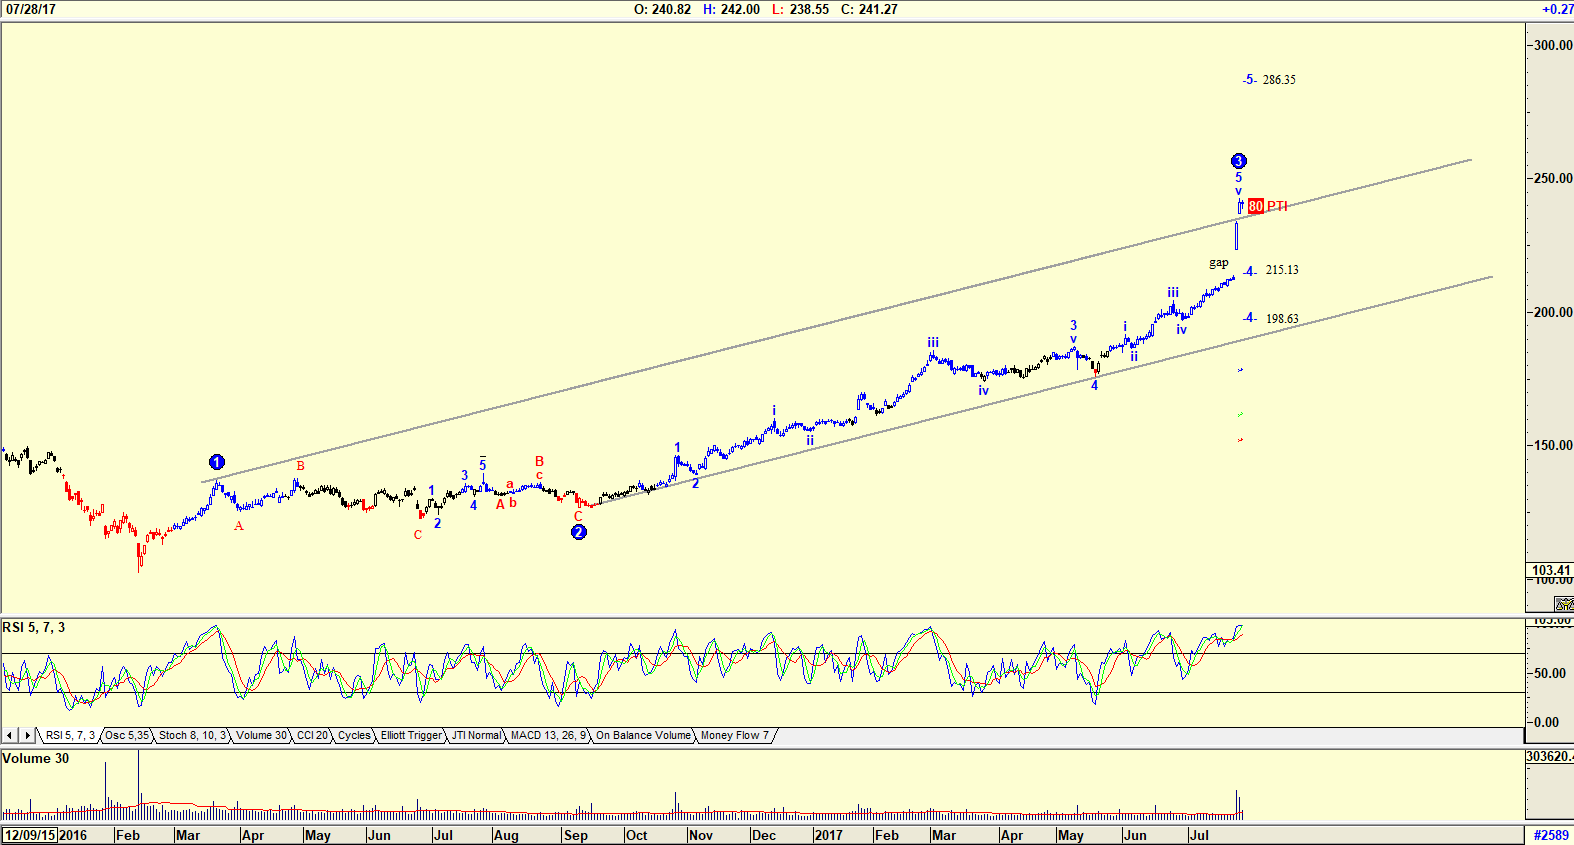
| Figure 2. Daily chart suggesting a wave 4 correction. |
| Graphic provided by: AdvancedGET. |
| |
| The chart in Figure 2 is a daily chart with an Elliott wave count suggesting that the share price is in a WAVE 3, and could fall in a WAVE 4 to either 215.13 or 198.63. Once this correction is complete, the share could rise in a WAVE 5 to 286.35. The RSI indicator is at overbought levels and could in the very near future give a sell signal with the share price dropping in a WAVE 4. The PTI (Probability Index) is 80, which is a high number suggesting that that possibility of a fall followed by a rise in WAVE 5 to 286.35 in the near future is very certain. The share price of Boeing has been very strong over the past years. A correction is on the cards, a certainty suggested by the daily chart of Figure 2. Waiting for that correction to occur is therefore a must before buying the share. |
Has been a technical analyst since 1969, and has worked as a futures and options trader with First Financial Futures in Johannesburg, South Africa.
| Address: | 3256 West 24th Ave |
| Vancouver, BC | |
| Phone # for sales: | 6042634214 |
| E-mail address: | petroosp@gmail.com |
Click here for more information about our publications!
PRINT THIS ARTICLE

Request Information From Our Sponsors
- VectorVest, Inc.
- Executive Premier Workshop
- One-Day Options Course
- OptionsPro
- Retirement Income Workshop
- Sure-Fire Trading Systems (VectorVest, Inc.)
- Trading as a Business Workshop
- VectorVest 7 EOD
- VectorVest 7 RealTime/IntraDay
- VectorVest AutoTester
- VectorVest Educational Services
- VectorVest OnLine
- VectorVest Options Analyzer
- VectorVest ProGraphics v6.0
- VectorVest ProTrader 7
- VectorVest RealTime Derby Tool
- VectorVest Simulator
- VectorVest Variator
- VectorVest Watchdog
- StockCharts.com, Inc.
- Candle Patterns
- Candlestick Charting Explained
- Intermarket Technical Analysis
- John Murphy on Chart Analysis
- John Murphy's Chart Pattern Recognition
- John Murphy's Market Message
- MurphyExplainsMarketAnalysis-Intermarket Analysis
- MurphyExplainsMarketAnalysis-Visual Analysis
- StockCharts.com
- Technical Analysis of the Financial Markets
- The Visual Investor
