HOT TOPICS LIST
- MACD
- Fibonacci
- RSI
- Gann
- ADXR
- Stochastics
- Volume
- Triangles
- Futures
- Cycles
- Volatility
- ZIGZAG
- MESA
- Retracement
- Aroon
INDICATORS LIST
LIST OF TOPICS
PRINT THIS ARTICLE
by Koos van der Merwe
With the probability that gold could start rising strongly, here are two shares one could play with.
Position: Buy
Koos van der Merwe
Has been a technical analyst since 1969, and has worked as a futures and options trader with First Financial Futures in Johannesburg, South Africa.
PRINT THIS ARTICLE
TECHNICAL ANALYSIS
Playing With Gold
08/03/17 12:36:33 PMby Koos van der Merwe
With the probability that gold could start rising strongly, here are two shares one could play with.
Position: Buy
| Once again, with the Presidential uncertainty with the Russian investigation of President Donald Trump catching the headlines, investors are treading cautiously, and looking for alternatives to protect their money. Gold and gold shares are always tempting, but is that the way to go? Two ETFs that captured my attention as something to play with are Direxion Daily Gold Miners Index BULL (NUGT) and Direxion Daily Gold Miners Index Bear (DUST). Yes, there are 83 Direxion ETFs listed on the US stock market, across all categories, but NUGT and DUST are two ETFs of many listed that play with gold. |

|
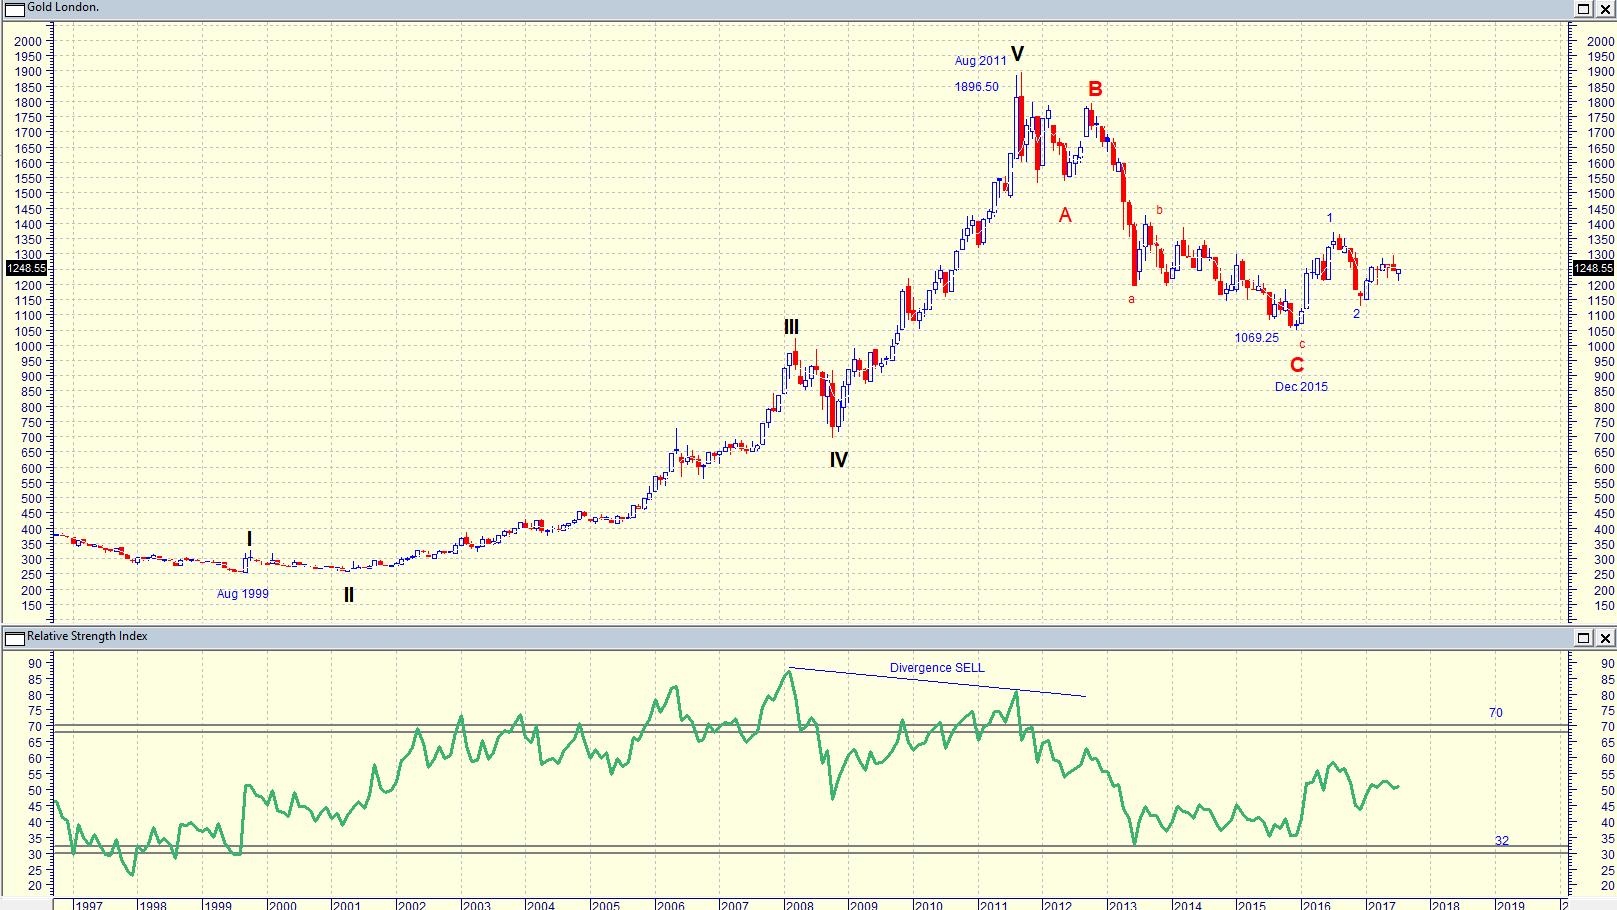
| Figure 1. Monthly chart of the Gold price. |
| Graphic provided by: MetaStock. |
| |
| The chart in Figure 1 is a long-term chart of the Gold price showing how the gold price topped out at 1896.50 in August 2011. The price of gold then fell to 1069.25 by December 2015 in a WAVE C, and has since risen in a Wave 1, fallen in a Wave 2 and could now be rising in the start of a Wave 3. The RSI indicator, which looks like it is trending upwards, confirms this. |

|
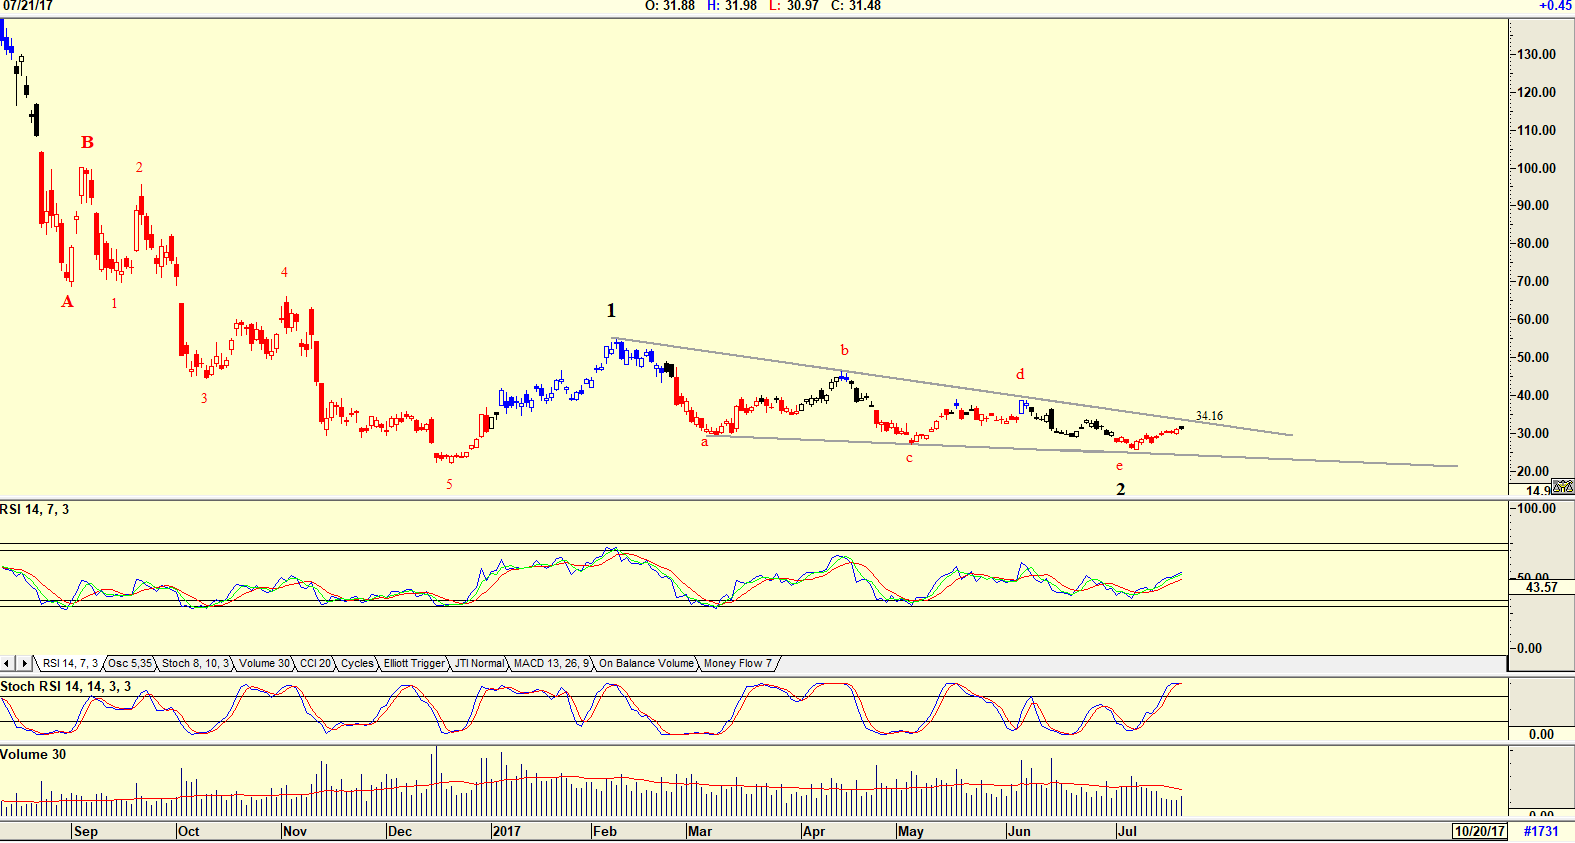
| Figure 2. Daily chart of NUGT. |
| Graphic provided by: AdvancedGET. |
| |
| The chart in Figure 2 is a daily chart of the Direxion Daily Gold Mining ETF (NUGT) with an Elliott wave count suggesting that a Wave 2 has been completed and that the ETF could now be starting to rise in a Wave 3. The resistance line is suggesting resistance at 34.16. The stochastic RSI indicator is suggesting the price could fall further, but the RSI 14 indicator is suggesting that the price could rise. The abcde pattern that has formed usually suggests that the price should break the resistance and rise in a Wave 3. |

|
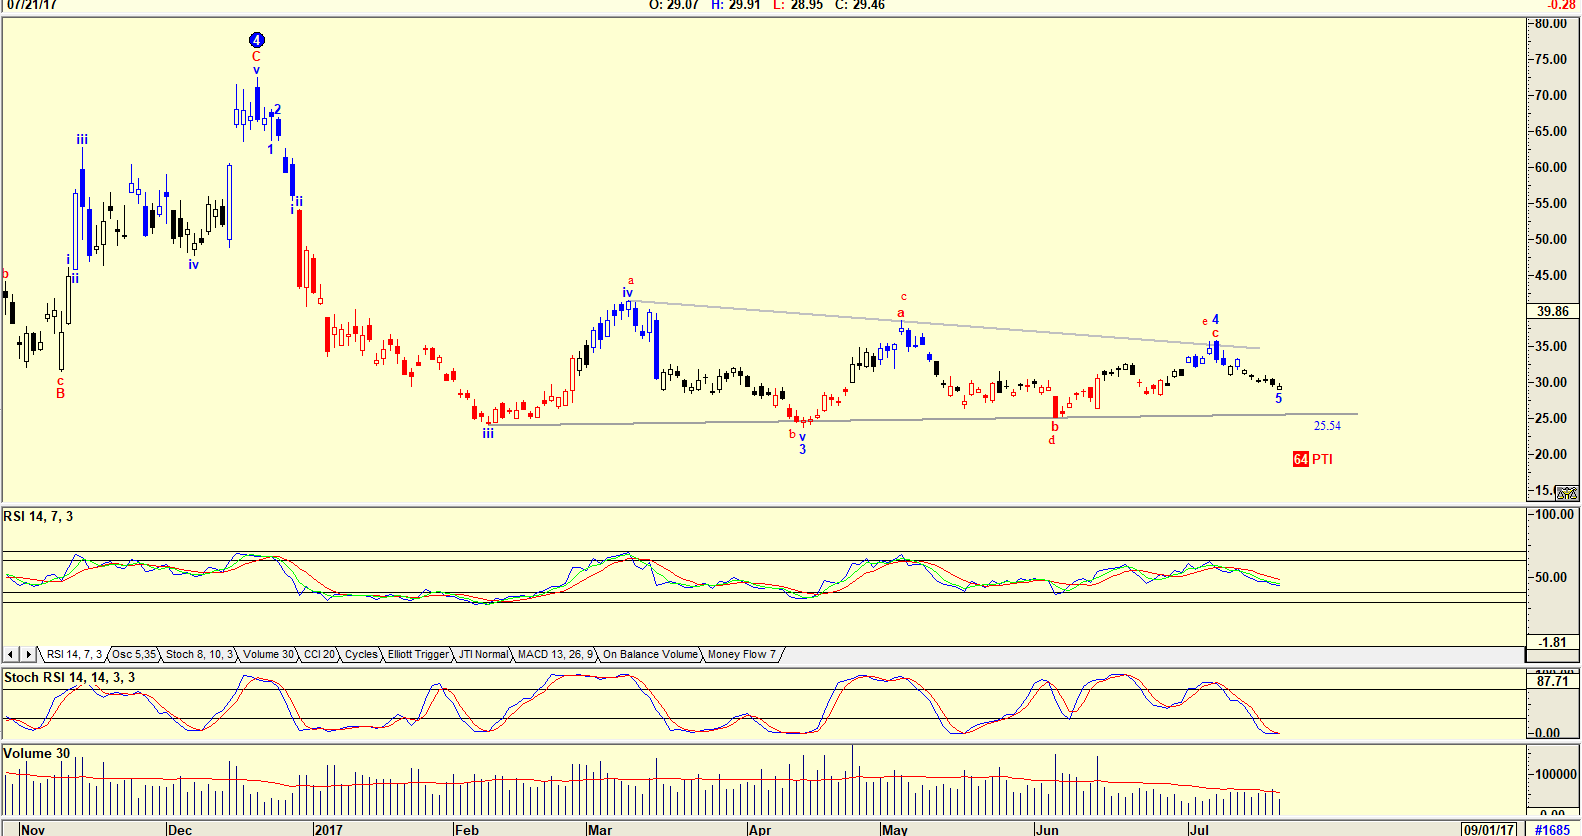
| Figure 3. Daily chart of DUST. |
| Graphic provided by: AdvancedGET. |
| |
| Looking at Figure 3, a chart of Direxion Gold Mining BEAR (DUST), an Elliott wave count suggested by the Advanced GET program confirms that the price of the ETF should fall. The target not shown on the chart is in the $5 region, and the PTI (Probability Index) at 64 is strong. There are many other Direxion Gold ETFs one can play with. By play, I mean either buying and selling the Gold BULL ETF (NUGT) or buying or selling the Gold BEAR ETF (DUST). For example, JNUG is the daily Junior Gold Miners Index BULL. With the uncertainty presently in the market, and slowly building up, this is possibly the way to go. Risky yet, and only for traders, but a good play that can be profitable. |
Has been a technical analyst since 1969, and has worked as a futures and options trader with First Financial Futures in Johannesburg, South Africa.
| Address: | 3256 West 24th Ave |
| Vancouver, BC | |
| Phone # for sales: | 6042634214 |
| E-mail address: | petroosp@gmail.com |
Click here for more information about our publications!
PRINT THIS ARTICLE

Request Information From Our Sponsors
- StockCharts.com, Inc.
- Candle Patterns
- Candlestick Charting Explained
- Intermarket Technical Analysis
- John Murphy on Chart Analysis
- John Murphy's Chart Pattern Recognition
- John Murphy's Market Message
- MurphyExplainsMarketAnalysis-Intermarket Analysis
- MurphyExplainsMarketAnalysis-Visual Analysis
- StockCharts.com
- Technical Analysis of the Financial Markets
- The Visual Investor
- VectorVest, Inc.
- Executive Premier Workshop
- One-Day Options Course
- OptionsPro
- Retirement Income Workshop
- Sure-Fire Trading Systems (VectorVest, Inc.)
- Trading as a Business Workshop
- VectorVest 7 EOD
- VectorVest 7 RealTime/IntraDay
- VectorVest AutoTester
- VectorVest Educational Services
- VectorVest OnLine
- VectorVest Options Analyzer
- VectorVest ProGraphics v6.0
- VectorVest ProTrader 7
- VectorVest RealTime Derby Tool
- VectorVest Simulator
- VectorVest Variator
- VectorVest Watchdog
