HOT TOPICS LIST
- MACD
- Fibonacci
- RSI
- Gann
- ADXR
- Stochastics
- Volume
- Triangles
- Futures
- Cycles
- Volatility
- ZIGZAG
- MESA
- Retracement
- Aroon
INDICATORS LIST
LIST OF TOPICS
PRINT THIS ARTICLE
by Koos van der Merwe
July, August and September are usually the quietest trading months of the year.
Position: Accumulate
Koos van der Merwe
Has been a technical analyst since 1969, and has worked as a futures and options trader with First Financial Futures in Johannesburg, South Africa.
PRINT THIS ARTICLE
TECHNICAL ANALYSIS
Going For Caution
07/26/17 05:19:58 PMby Koos van der Merwe
July, August and September are usually the quietest trading months of the year.
Position: Accumulate
| With the recent news about the meeting between members of President Trump's family and a Russian lawyer, sophisticated investors are starting to become cautious. More and more of them are putting out notices to clients that they are expecting a downside move in the stock market and that their clients should rather look for stocks that pay monthly dividends or interest rather than go for capital gains. Are they correct? Time will tell, but without any doubt the news hitting the air regarding the Trump Presidency does cause butterflies in one's stomach. Erring on the side of caution could tame those butterflies. |

|
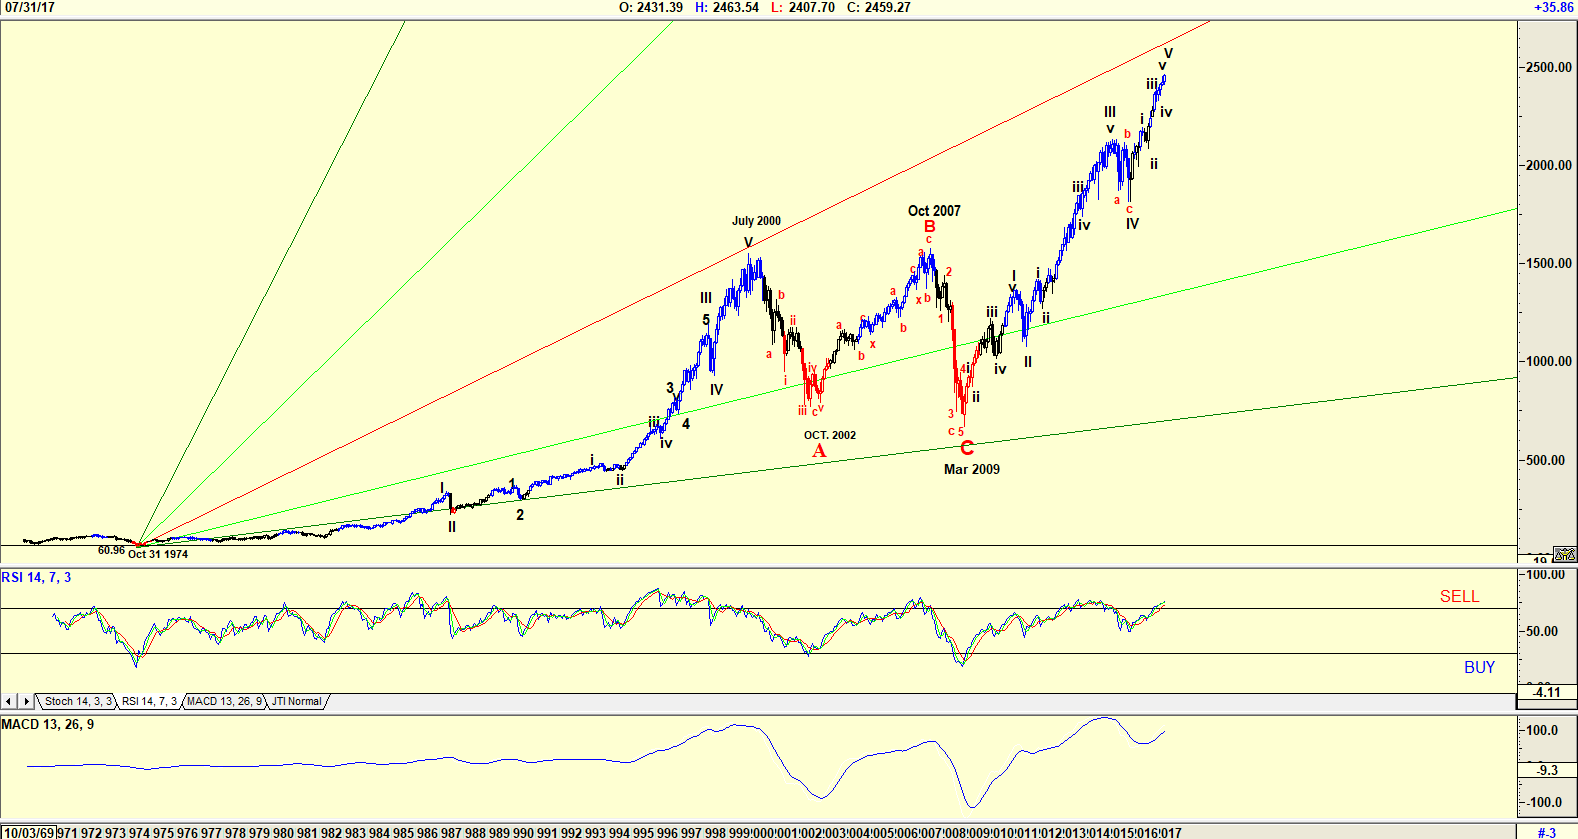
| Figure 1. Monthly chart of the S&P 500 Index. |
| Graphic provided by: AdvancedGET. |
| |
| The chart in Figure 1 is a monthly chart of the S&P 500 index with a Gann fan drawn from October 31, 1974, and an Elliott wave count suggesting that the index could be in a WAVE V of a Wave v. Do notice that although prices did not bounce off Gann fan lines, they came very close to them, suggesting to investors that in the near future, caution is necessary. The Elliott wave count is confirming this, as is the RSI Index which is at overbought levels and the MACD Index, a long-term index suggesting that a divergence sell could be on the cards. A divergence sell is where the index makes higher highs, but the index suggests lower highs for the sell signals. |

|
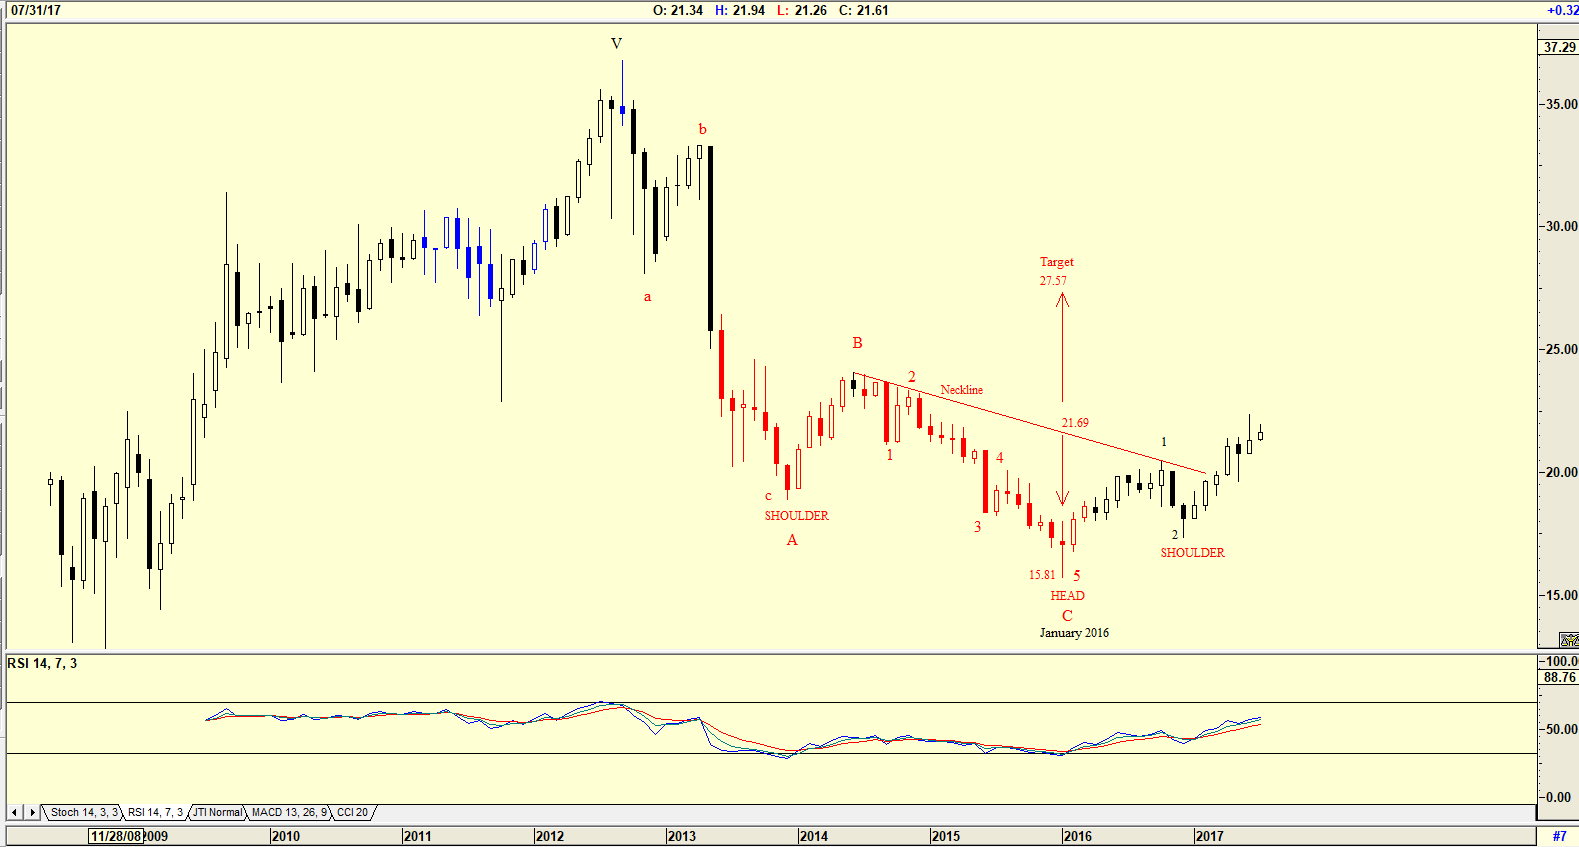
| Figure 2. Monthly Chart of AGNC. |
| Graphic provided by: AdvancedGET. |
| |
| With this uncertainty shown in the index in Figure 1, investors start looking for security. A look at AGNC Investment Corp is one of many probabilities. The Company announced on July 13 that they would be paying a common stock dividend of $0.18 per common share for July 2017. A look at the monthly chart shows an Elliott wave count that suggests that in January 2016 the share price bottomed in a WAVE C correction. The chart pattern also suggests that an inverse head-and-shoulder pattern has formed, with a target of $27.57 (21.69-15.81=5.88+21.69=27.57). |

|
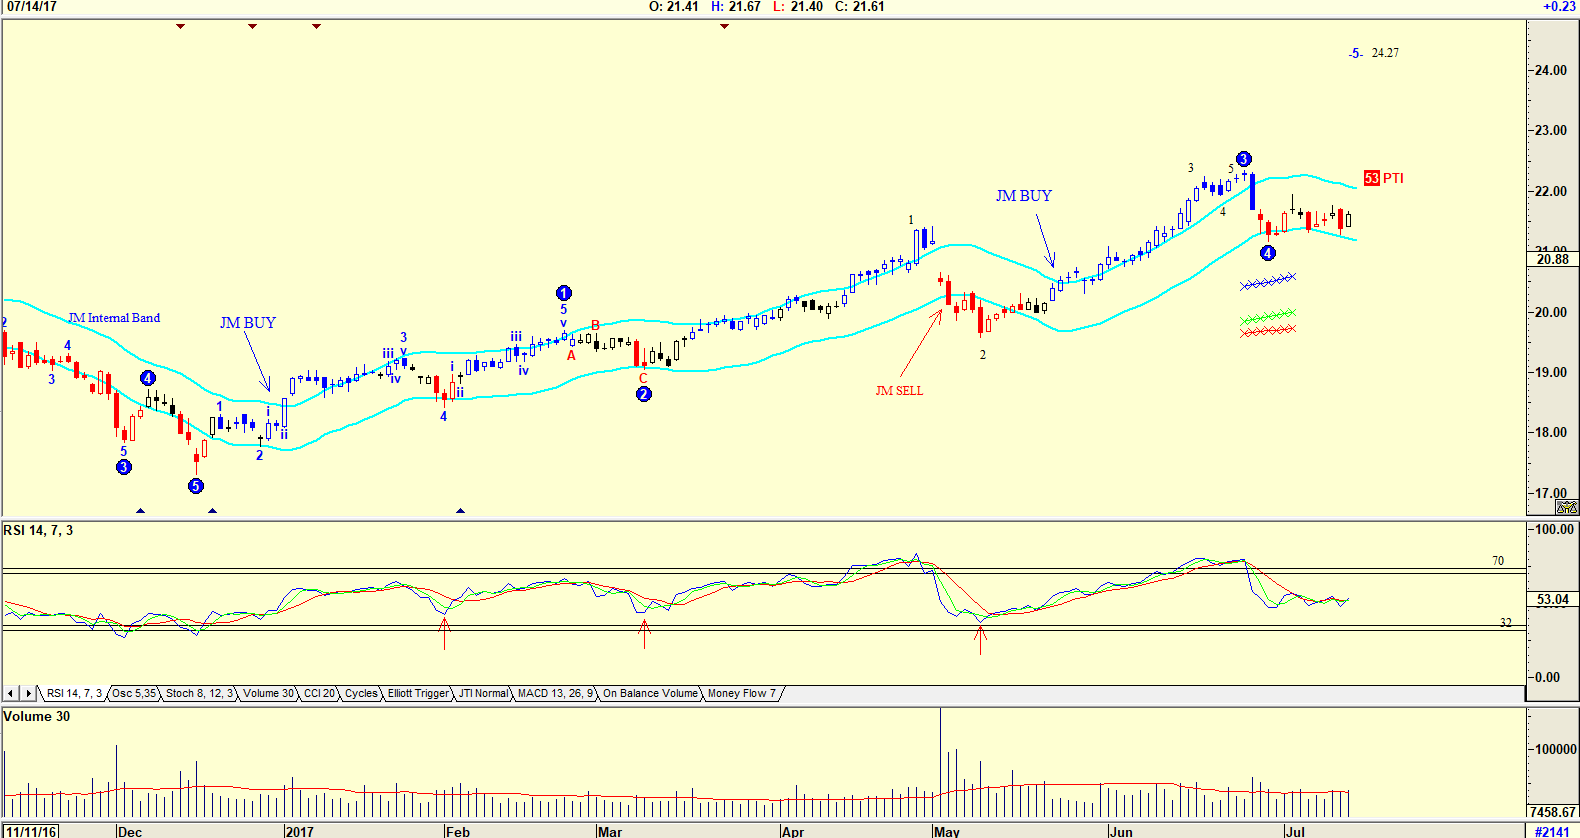
| Figure 3. Daily chart of AGNC. |
| Graphic provided by: AdvancedGET. |
| |
| The chart in Figure 3 is a daily chart of AGNC, with an Elliott wave count suggesting that the chart could be moving up in a WAVE 5 to $24.27. The PTI (probability Index) is 53 which is acceptable. The RSI index is, however, trending down, suggesting further downside before the rise. However, looking back at history, there are 3 instances shown by the arrows where the stock price rose without the RSI falling below the 32-horizontal and then giving a buy. Do note the JM Internal Band which is still in buy mode. The JM Internal Band is a simple 15-period moving average offset by 2% positive and 2% negative. A move above the upper band suggests a buy and below the lower band a sell. Going for caution is probably the way to go, with the summer holidays suggesting that many investors are out of the market relaxing and enjoying a rest. With the month of October two months away, a month well known for its stock market crashe,s and finally with the present Trump political uncertainty as to the Russian probe, looking for secure investments is a must. |
Has been a technical analyst since 1969, and has worked as a futures and options trader with First Financial Futures in Johannesburg, South Africa.
| Address: | 3256 West 24th Ave |
| Vancouver, BC | |
| Phone # for sales: | 6042634214 |
| E-mail address: | petroosp@gmail.com |
Click here for more information about our publications!
PRINT THIS ARTICLE

Request Information From Our Sponsors
- StockCharts.com, Inc.
- Candle Patterns
- Candlestick Charting Explained
- Intermarket Technical Analysis
- John Murphy on Chart Analysis
- John Murphy's Chart Pattern Recognition
- John Murphy's Market Message
- MurphyExplainsMarketAnalysis-Intermarket Analysis
- MurphyExplainsMarketAnalysis-Visual Analysis
- StockCharts.com
- Technical Analysis of the Financial Markets
- The Visual Investor
- VectorVest, Inc.
- Executive Premier Workshop
- One-Day Options Course
- OptionsPro
- Retirement Income Workshop
- Sure-Fire Trading Systems (VectorVest, Inc.)
- Trading as a Business Workshop
- VectorVest 7 EOD
- VectorVest 7 RealTime/IntraDay
- VectorVest AutoTester
- VectorVest Educational Services
- VectorVest OnLine
- VectorVest Options Analyzer
- VectorVest ProGraphics v6.0
- VectorVest ProTrader 7
- VectorVest RealTime Derby Tool
- VectorVest Simulator
- VectorVest Variator
- VectorVest Watchdog
