HOT TOPICS LIST
- MACD
- Fibonacci
- RSI
- Gann
- ADXR
- Stochastics
- Volume
- Triangles
- Futures
- Cycles
- Volatility
- ZIGZAG
- MESA
- Retracement
- Aroon
INDICATORS LIST
LIST OF TOPICS
PRINT THIS ARTICLE
by Koos van der Merwe
Looking for a safe, long-term investment is always a must.
Position: Accumulate
Koos van der Merwe
Has been a technical analyst since 1969, and has worked as a futures and options trader with First Financial Futures in Johannesburg, South Africa.
PRINT THIS ARTICLE
TECHNICAL ANALYSIS
Is Apple A Buy?
07/14/17 03:06:10 PMby Koos van der Merwe
Looking for a safe, long-term investment is always a must.
Position: Accumulate
| The company, Apple Inc., has changed a great deal since the death of Steve Jobs on October 5, 2011. The company has thrived under his successor, Timothy Donald Cook, moving from a share price of $52.39 to a high of $156.28. At its present price of $144.18, the question on every investor's mind is whether it is time to buy the share? Rumours abound as to what Tim Cook has up his sleeve that will push the price even higher, but nothing has been verified. The company has gone from a company with almost unbelievable growth rates to a company that is returning capital to its shareholders in amounts that are unprecedented. The yield on its dividend is only 1.7% at its present price, not that attractive, but it is the question, "What has Tim Cook up his sleeve?" that attracts buyers. |

|
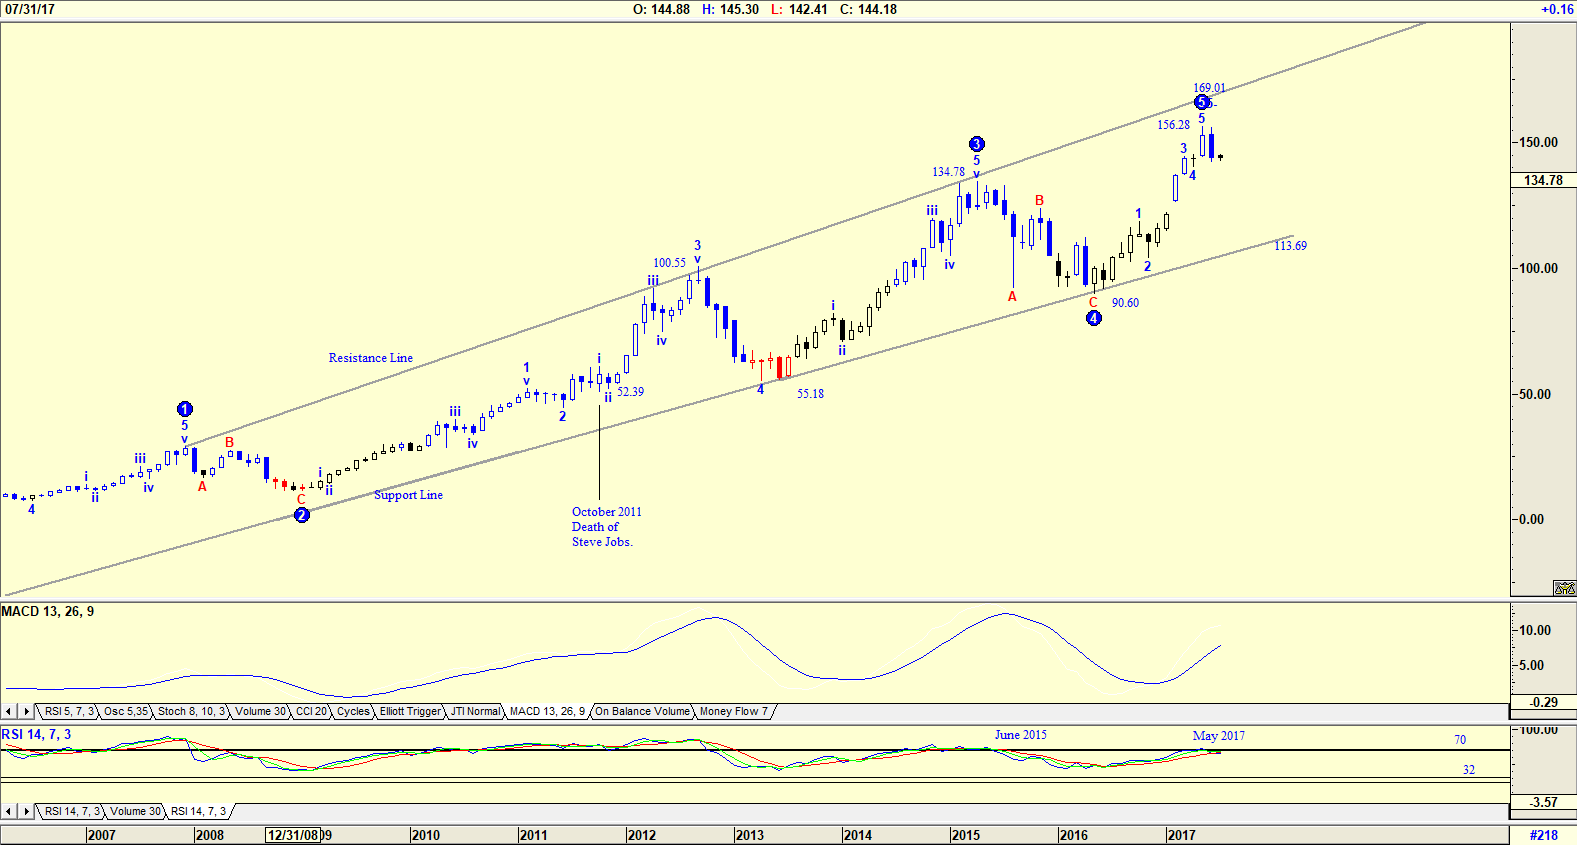
| Figure 1. Monthly chart with Elliott wave count. |
| Graphic provided by: AdvancedGET. |
| |
| The chart in Figure 1 is a monthly chart with an Elliott wave count suggesting that the share price could be completing a WAVE 5 top. However, the resistance line is suggesting that the price could rise to $169.00 before correcting in a major ABC correction to somewhere between $100.55 and $55.18, the 4th Wave of lesser degree. The support line is suggesting support at the $113.69 range, but the support line is not brick solid, and could give way to a strong price drop. The MACD indicator has not yet given a sell signal, but it is starting to look weak. The RSI indicator, on the other hand, gave a sell signal in May 2017 and is suggesting that the share price should start falling. |

|
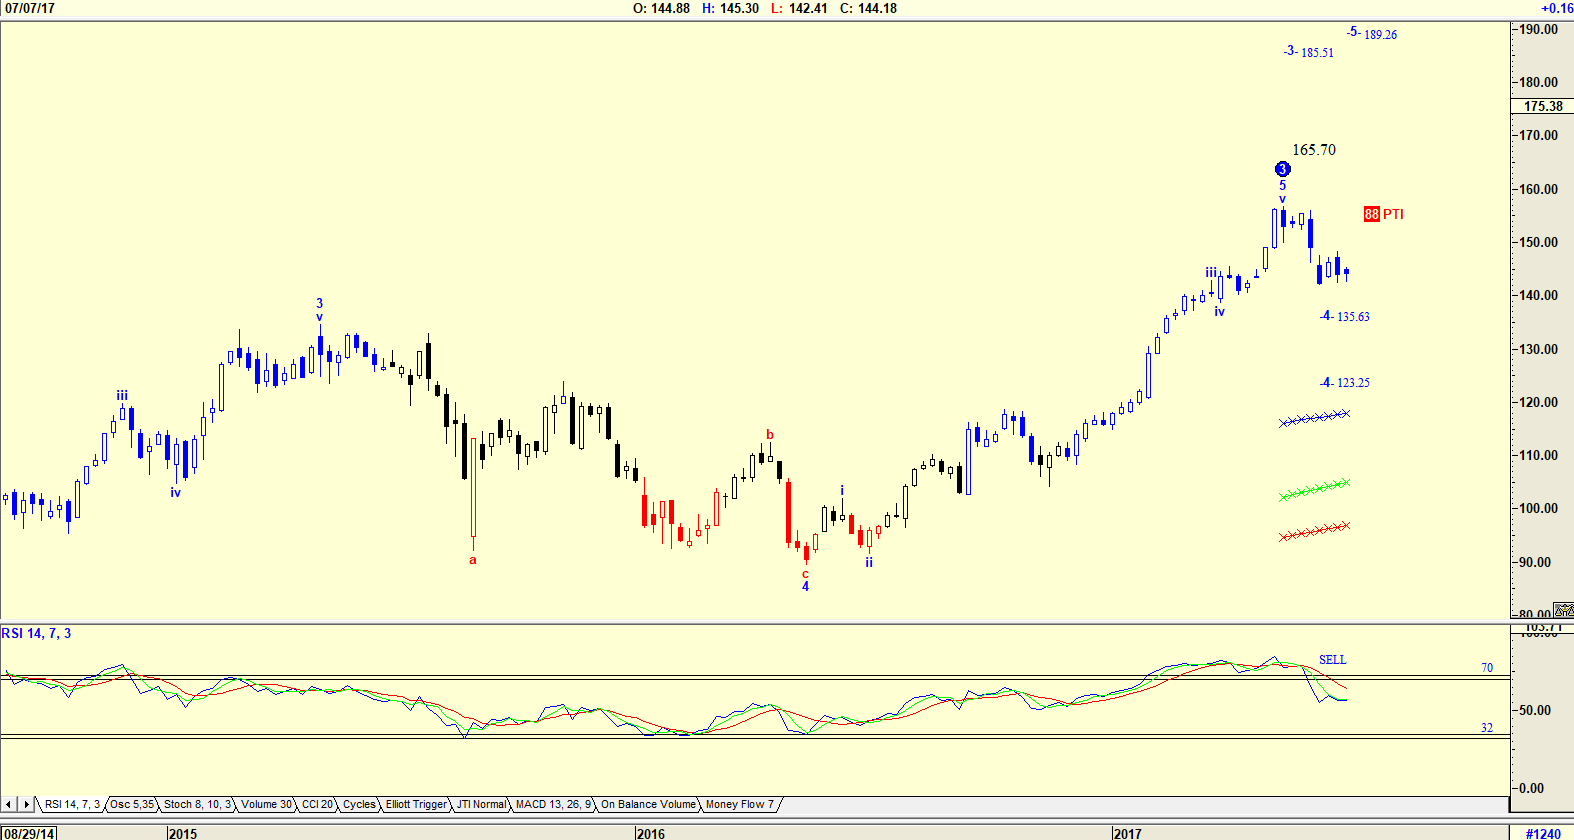
| Figure 2. Weekly chart with Elliott wave count. |
| Graphic provided by: AdvancedGET. |
| |
| The weekly chart in Figure 2 is showing the sell signal clearly given by the RSI Indicator, suggesting that the price could drop in a WAVE 4 to either $135.63 or $123.25. However, the Advanced GET Elliott wave count is suggesting that the WAVE 3 could top out at the higher price of $185.51 before the WAVE 4 correction. The chart is also suggesting a WAVE 5 target of $189.26 with a high PTI (Probability Index) of 88. |

|
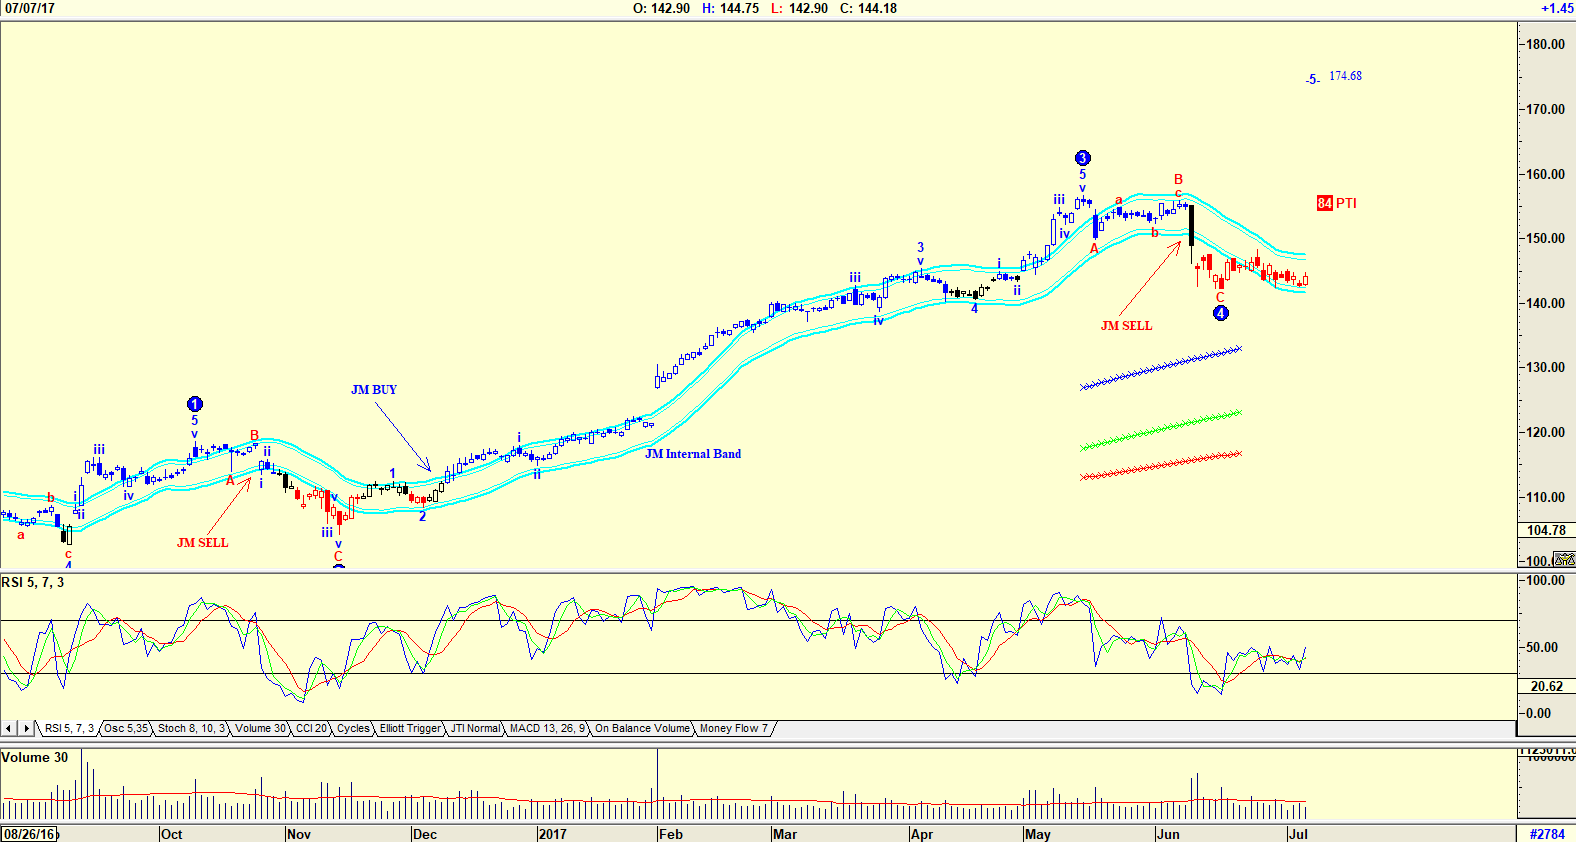
| Figure 3. Daily chart with Elliott wave count and JM Internal Band. |
| Graphic provided by: AdvancedGET. |
| |
| The chart in Figure 3 is a daily chart with an Elliott wave count suggesting that the share price is moving into a WAVE 5 at $174.68. The PTI is 84, a high figure, and with the RSI in buy mode, this is very possible. Do note that volume has weakened as the price fell, suggesting strength. The share price has not given a JM Internal Band buy, a strategy followed by long term investors. The JM Internal Band is a 15-period simple moving average offset by 2% positive band and 2% negative band. A move above the upper band suggests a buy and below the lower band a sell as shown on the chart. |

|
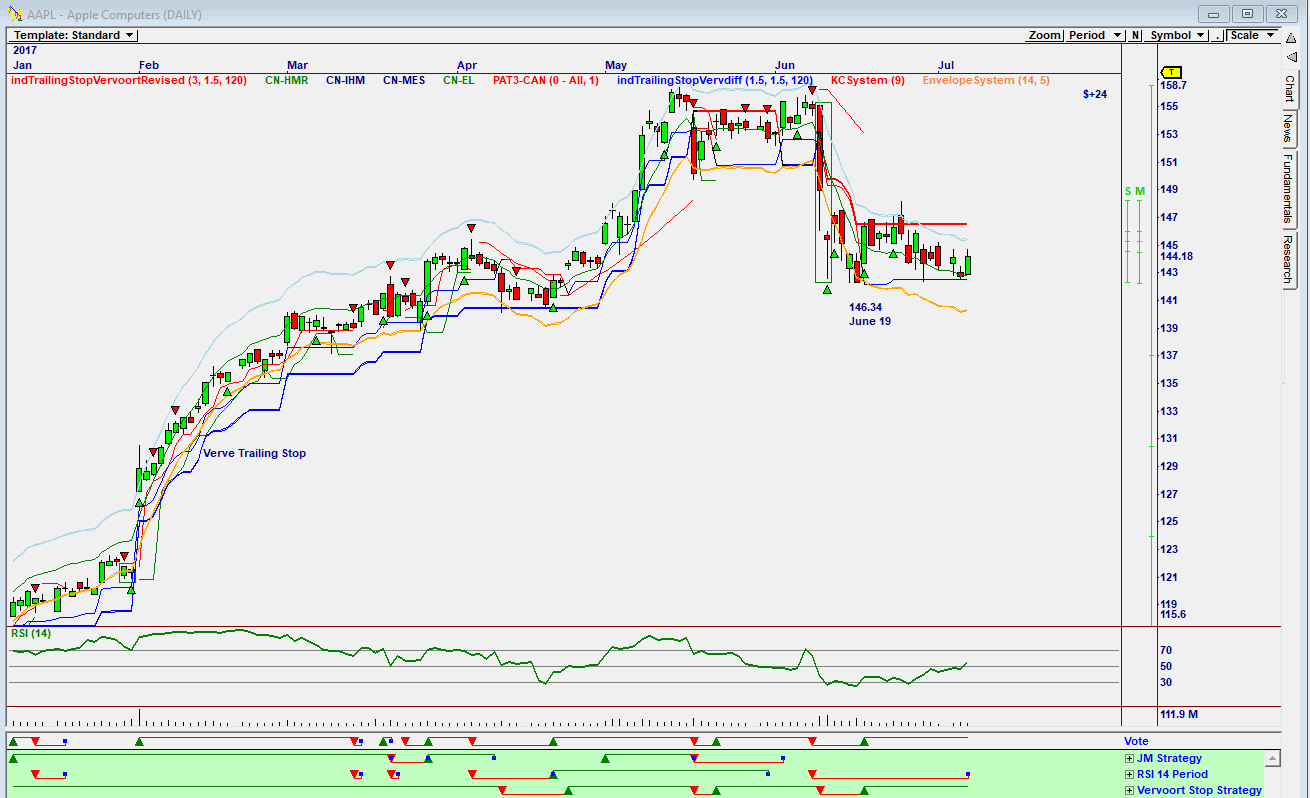
| Figure 4. Omnitrader chart showing a buy signal. |
| Graphic provided by: Omnitrader. |
| |
| The chart in Figure 4 is an Omnitrader chart with the Vote line suggesting a buy on June 19 at $146.34, based on the Vervoort Stop Strategy shown below the Vote line. Buying APPLE stock at its present price is taking a gamble on rumors leaving Tim Cook's mouth. Is Apple going to compete with Tesla? Does he have an Apple iPhone up his sleeve that will revolutionize the industry. One should never forget that the Apple iWatch was not the success Apple hoped it would be, but, and that "but" is a big one, Apple always surprises us with innovation. Buying the share on a dip could be the way to go. |
Has been a technical analyst since 1969, and has worked as a futures and options trader with First Financial Futures in Johannesburg, South Africa.
| Address: | 3256 West 24th Ave |
| Vancouver, BC | |
| Phone # for sales: | 6042634214 |
| E-mail address: | petroosp@gmail.com |
Click here for more information about our publications!
Comments
Date: 07/28/17Rank: 4Comment:

Request Information From Our Sponsors
- VectorVest, Inc.
- Executive Premier Workshop
- One-Day Options Course
- OptionsPro
- Retirement Income Workshop
- Sure-Fire Trading Systems (VectorVest, Inc.)
- Trading as a Business Workshop
- VectorVest 7 EOD
- VectorVest 7 RealTime/IntraDay
- VectorVest AutoTester
- VectorVest Educational Services
- VectorVest OnLine
- VectorVest Options Analyzer
- VectorVest ProGraphics v6.0
- VectorVest ProTrader 7
- VectorVest RealTime Derby Tool
- VectorVest Simulator
- VectorVest Variator
- VectorVest Watchdog
- StockCharts.com, Inc.
- Candle Patterns
- Candlestick Charting Explained
- Intermarket Technical Analysis
- John Murphy on Chart Analysis
- John Murphy's Chart Pattern Recognition
- John Murphy's Market Message
- MurphyExplainsMarketAnalysis-Intermarket Analysis
- MurphyExplainsMarketAnalysis-Visual Analysis
- StockCharts.com
- Technical Analysis of the Financial Markets
- The Visual Investor
