HOT TOPICS LIST
- MACD
- Fibonacci
- RSI
- Gann
- ADXR
- Stochastics
- Volume
- Triangles
- Futures
- Cycles
- Volatility
- ZIGZAG
- MESA
- Retracement
- Aroon
INDICATORS LIST
LIST OF TOPICS
PRINT THIS ARTICLE
by Gary Grosschadl
Island reversals are topping formations, rather uncommon they often portend considerable downside action.
Position: Sell
Gary Grosschadl
Independent Canadian equities trader and technical analyst based in Peterborough
Ontario, Canada.
PRINT THIS ARTICLE
ISLAND REVERSAL
Island Reversal Pattern For The Nasdaq
12/06/02 10:38:10 AMby Gary Grosschadl
Island reversals are topping formations, rather uncommon they often portend considerable downside action.
Position: Sell
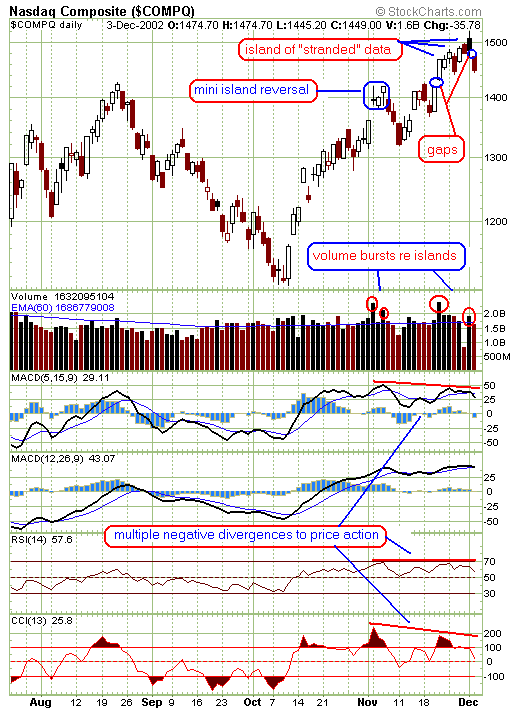
| Island reversals are characterized by extended bullish runs that develop a gap up and then after a few trading sessions suddenly gap down, leaving a "high grouping" of stranded data. The most common reason for such a pattern is a reaction to news on both gap occurances and this was the case with the Nasdaq. The past week was a busy one with a spate of economic news. Traders were enthused enough with several economic reports showing three key upside surprises: durable orders were up 2.8% vs. an expected 1.8% rise; Chicago PMI came in 54.3 vs. an expected 48.5; and initial jobless claims 364,000 vs. an expected 383,000. The following day, traders were especially eager and gapped the index upwards as many stocks gapped too. Several trading days later there was a lack of exciting news so traders were looking for an excuse to gap down and they found one. On December 2, 2002 the ISM (manufacturing) report was worse than expected (49.2 vs 51). |
| Volume considerations for these trend killer patterns have a burst of stonger volume on both sides of the gap and as the chart shows, this was correct. |

|
| Graphic provided by: StockCharts.com. |
| |
| Even before this island reversal emerged, warning signs came via several negative divergences as depicted on the chart. Since the uptrend was quite strong I had originally expected an orderly retracement to nearby moving averages but now I leave the door open to a steeper decline in the coming weeks. But as always the market will show us the way and traders should be alert to the shifting sands. The island reversal is a heads up signal cautioning that the bull run may be rudely interrupted so some healthy scepticism is prudent. Despite these bullish weeks, the markets remain reversal oriented. |
| A further interesting note on this chart is the "mini" island reversal which was immediately followed by a three day downdraft. The current pattern is larger and therefore carries a bigger stick. |
Independent Canadian equities trader and technical analyst based in Peterborough
Ontario, Canada.
| Website: | www.whatsonsale.ca/financial.html |
| E-mail address: | gwg7@sympatico.ca |
Click here for more information about our publications!
Comments
Date: 12/07/02Rank: 4Comment:
Date: 12/08/02Rank: 4Comment:
Date: 12/10/02Rank: 5Comment:
Date: 12/10/02Rank: 5Comment:
Date: 12/11/02Rank: 5Comment:
Date: 12/25/02Rank: 5Comment:
Date: 12/28/02Rank: 5Comment:

|

Request Information From Our Sponsors
- StockCharts.com, Inc.
- Candle Patterns
- Candlestick Charting Explained
- Intermarket Technical Analysis
- John Murphy on Chart Analysis
- John Murphy's Chart Pattern Recognition
- John Murphy's Market Message
- MurphyExplainsMarketAnalysis-Intermarket Analysis
- MurphyExplainsMarketAnalysis-Visual Analysis
- StockCharts.com
- Technical Analysis of the Financial Markets
- The Visual Investor
- VectorVest, Inc.
- Executive Premier Workshop
- One-Day Options Course
- OptionsPro
- Retirement Income Workshop
- Sure-Fire Trading Systems (VectorVest, Inc.)
- Trading as a Business Workshop
- VectorVest 7 EOD
- VectorVest 7 RealTime/IntraDay
- VectorVest AutoTester
- VectorVest Educational Services
- VectorVest OnLine
- VectorVest Options Analyzer
- VectorVest ProGraphics v6.0
- VectorVest ProTrader 7
- VectorVest RealTime Derby Tool
- VectorVest Simulator
- VectorVest Variator
- VectorVest Watchdog
