HOT TOPICS LIST
- MACD
- Fibonacci
- RSI
- Gann
- ADXR
- Stochastics
- Volume
- Triangles
- Futures
- Cycles
- Volatility
- ZIGZAG
- MESA
- Retracement
- Aroon
INDICATORS LIST
LIST OF TOPICS
PRINT THIS ARTICLE
by Koos van der Merwe
Pfizer is a pharmaceutical company headquartered in New York City.
Position: Sell
Koos van der Merwe
Has been a technical analyst since 1969, and has worked as a futures and options trader with First Financial Futures in Johannesburg, South Africa.
PRINT THIS ARTICLE
TECHNICAL ANALYSIS
Pfizer, Inc.
06/28/17 03:38:59 PMby Koos van der Merwe
Pfizer is a pharmaceutical company headquartered in New York City.
Position: Sell
| Pfizer is a research-based pharmaceutical company. Its discovery of Terramycin in 1950 put the company on the path to becoming a major research pharmaceutical company. Since then the company has grown, with numerous acquisitions that included Wyeth in 2009, a major company with many products, for $68 billion. Today, one of its most well-known products is Viagra, which it discovered by accident. The drug sildenafil was originally discovered as a treatment for hypertension and angina pectoris. The company noticed that one of the side effects caused by the drug was penile erection. Pfizer then decided to market the drug for erectile dysfunction rather than for angina, and Viagra became the first oral treatment approved to treat erectile dysfunction, becoming a great success with annual sales in 2008 peaking at $1.934 billion. Today, its primary competitors are Cialis and Levitra, as well as numerous generic versions. Pfizer has become one of the world's premier research and development companies working to discover and develop innovative, safe and effective ways to treat and prevent some of the world's most challenging diseases. |

|
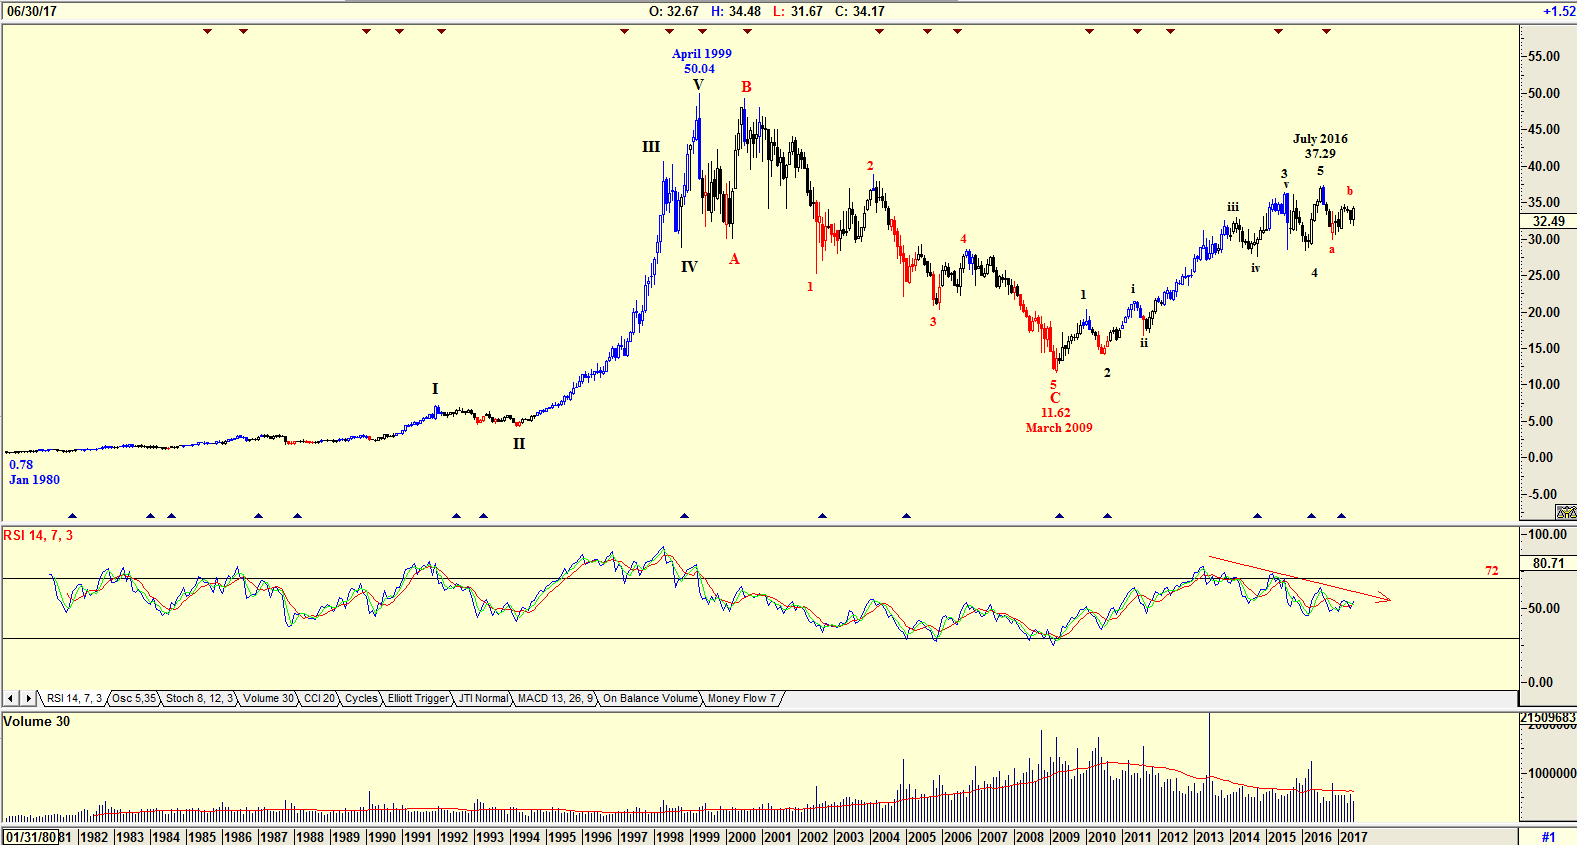
| Figure 1. Monthly Chart. |
| Graphic provided by: AdvancedGET. |
| |
| The chart in Figure 1 is a monthly chart showing how the share price moved from a low of $0.78 in January 1980 to a high of $50.04 by April 1999 in an Elliott wave V count. From that date, the share price fell in an ABC correction to $11.62 by March 2009. The share price has since risen in a wave 5 to $37.29 by July 2016. With the RSI indicator, suggesting a divergence sell signal, the share price could fall further or trend sideways. A divergence sell signal is where the RSI starts falling below the 72-horizontal while the share price continues rising. Do note that volume is also falling. |

|
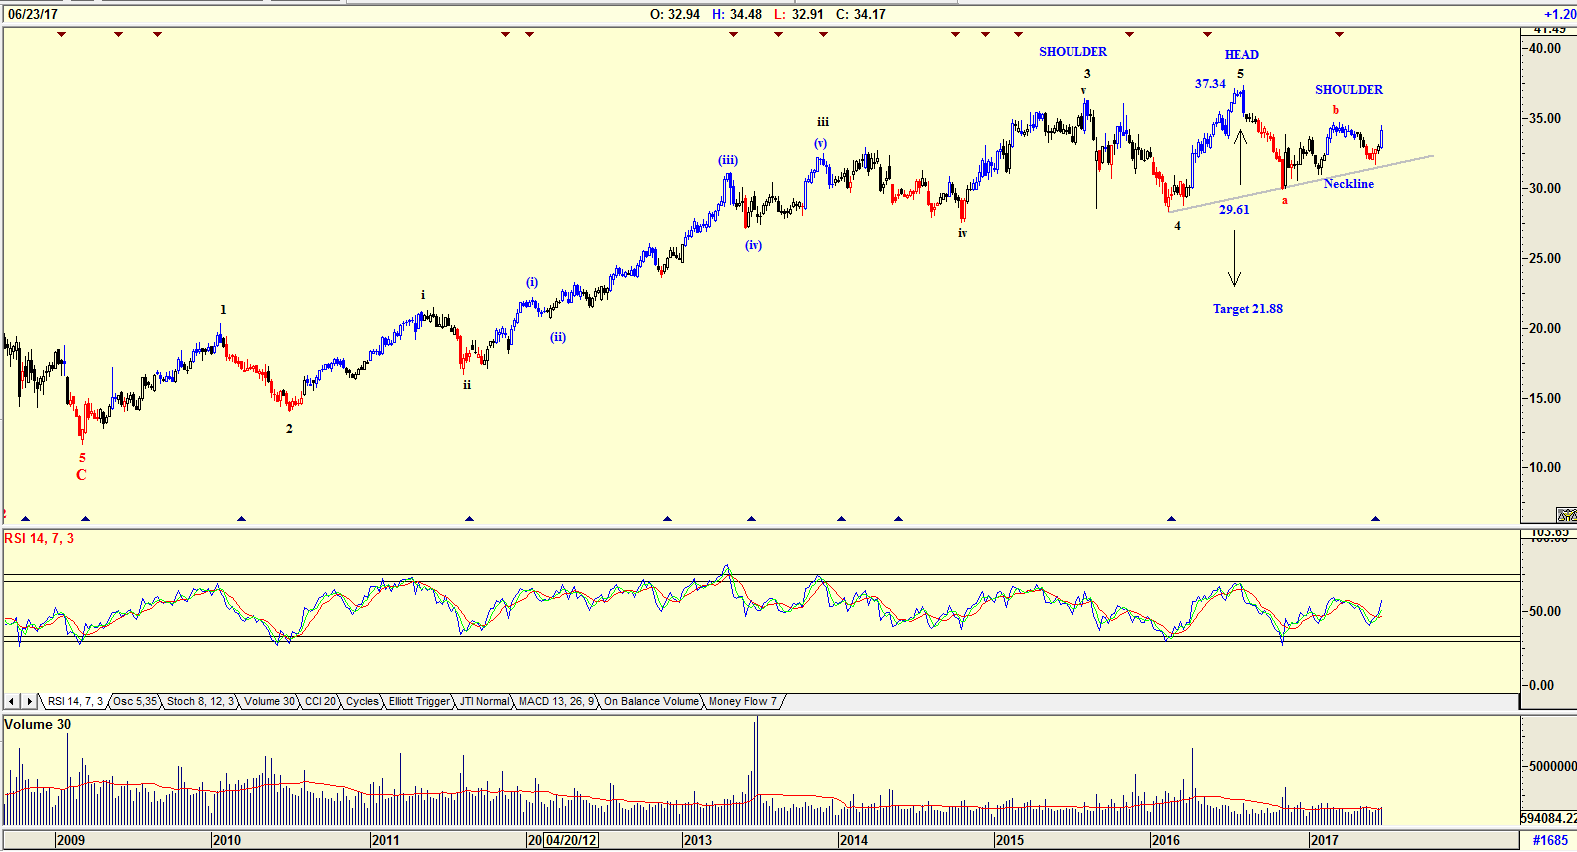
| Figure 2. Weekly Chart. |
| Graphic provided by: AdvancedGET. |
| |
| The chart in Figure 2 is a weekly chart suggesting that with a Wave 5 top, the share price could be forming a head and shoulder formation. Should this be so, then the share price when it falls below the neckline could fall to $21.88. The RSI indicator is however moving up. |

|
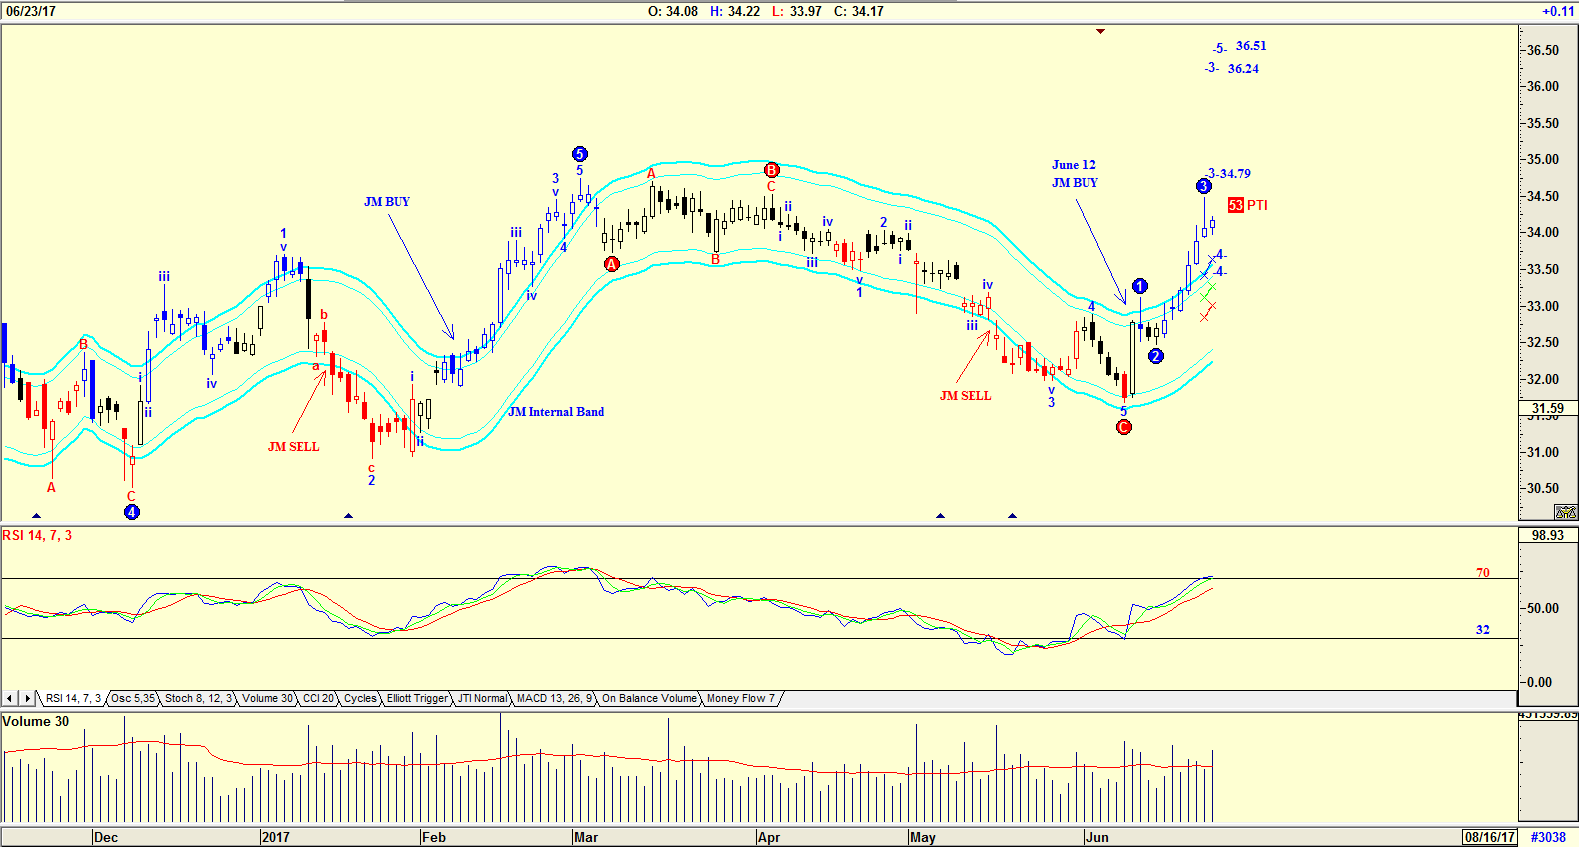
| Figure 3. Daily Chart. |
| Graphic provided by: AdvancedGET. |
| |
| The chart in Figure 3 is a daily chart with an Elliott wave count suggesting that the share price should rise in a WAVE 3 to $34.79 or $36.24. The PTI (Probability Index) is 53, suggesting that the chance of this happening is only 53%. The RSI indicator is above the 70-horizontal, but has not yet given a sell signal. The JM Internal Band indicator suggested a buy on June 12th. The JM Internal Band is a 15-period simple moving average offset by 2% positive and 2% negative. A move above the upper band suggests a buy, and below the lower band a sell. Do note that volume with the recent rise is above average, suggesting strength. Pfizer is a share that should be in one's watch portfolio. The share is not a buy, at present, but can be bought on a correction. Watching the RSI indicator and waiting for that correction is probably the way to go. What is a concern for most pharmaceutical companies is the Obamacare revision that is being debated in the Senate. To what extent the price of drugs is being considered is unknown. |
Has been a technical analyst since 1969, and has worked as a futures and options trader with First Financial Futures in Johannesburg, South Africa.
| Address: | 3256 West 24th Ave |
| Vancouver, BC | |
| Phone # for sales: | 6042634214 |
| E-mail address: | petroosp@gmail.com |
Click here for more information about our publications!
Comments

|

Request Information From Our Sponsors
- StockCharts.com, Inc.
- Candle Patterns
- Candlestick Charting Explained
- Intermarket Technical Analysis
- John Murphy on Chart Analysis
- John Murphy's Chart Pattern Recognition
- John Murphy's Market Message
- MurphyExplainsMarketAnalysis-Intermarket Analysis
- MurphyExplainsMarketAnalysis-Visual Analysis
- StockCharts.com
- Technical Analysis of the Financial Markets
- The Visual Investor
- VectorVest, Inc.
- Executive Premier Workshop
- One-Day Options Course
- OptionsPro
- Retirement Income Workshop
- Sure-Fire Trading Systems (VectorVest, Inc.)
- Trading as a Business Workshop
- VectorVest 7 EOD
- VectorVest 7 RealTime/IntraDay
- VectorVest AutoTester
- VectorVest Educational Services
- VectorVest OnLine
- VectorVest Options Analyzer
- VectorVest ProGraphics v6.0
- VectorVest ProTrader 7
- VectorVest RealTime Derby Tool
- VectorVest Simulator
- VectorVest Variator
- VectorVest Watchdog
