HOT TOPICS LIST
- MACD
- Fibonacci
- RSI
- Gann
- ADXR
- Stochastics
- Volume
- Triangles
- Futures
- Cycles
- Volatility
- ZIGZAG
- MESA
- Retracement
- Aroon
INDICATORS LIST
LIST OF TOPICS
PRINT THIS ARTICLE
by Koos van der Merwe
So, where are the FANG stocks going?
Position: Sell
Koos van der Merwe
Has been a technical analyst since 1969, and has worked as a futures and options trader with First Financial Futures in Johannesburg, South Africa.
PRINT THIS ARTICLE
TECHNICAL ANALYSIS
Fang
06/23/17 02:51:20 PMby Koos van der Merwe
So, where are the FANG stocks going?
Position: Sell
| FANG is an acronym create by TheStreet's Jim Cramer a few years ago. The name represents four of the most popular and best performing tech stocks. The stocks are Facebook, Amazon, Netflix and Google. With the recent market uncertainty, these stocks have been correcting strongly, and are suggesting that it may be time to panic and sell the stocks you own. The present political uncertainty in the USA is growing and the market is becoming complicated and risky, so, let us have a look at the FANG stocks and see what they are telling us. |

|
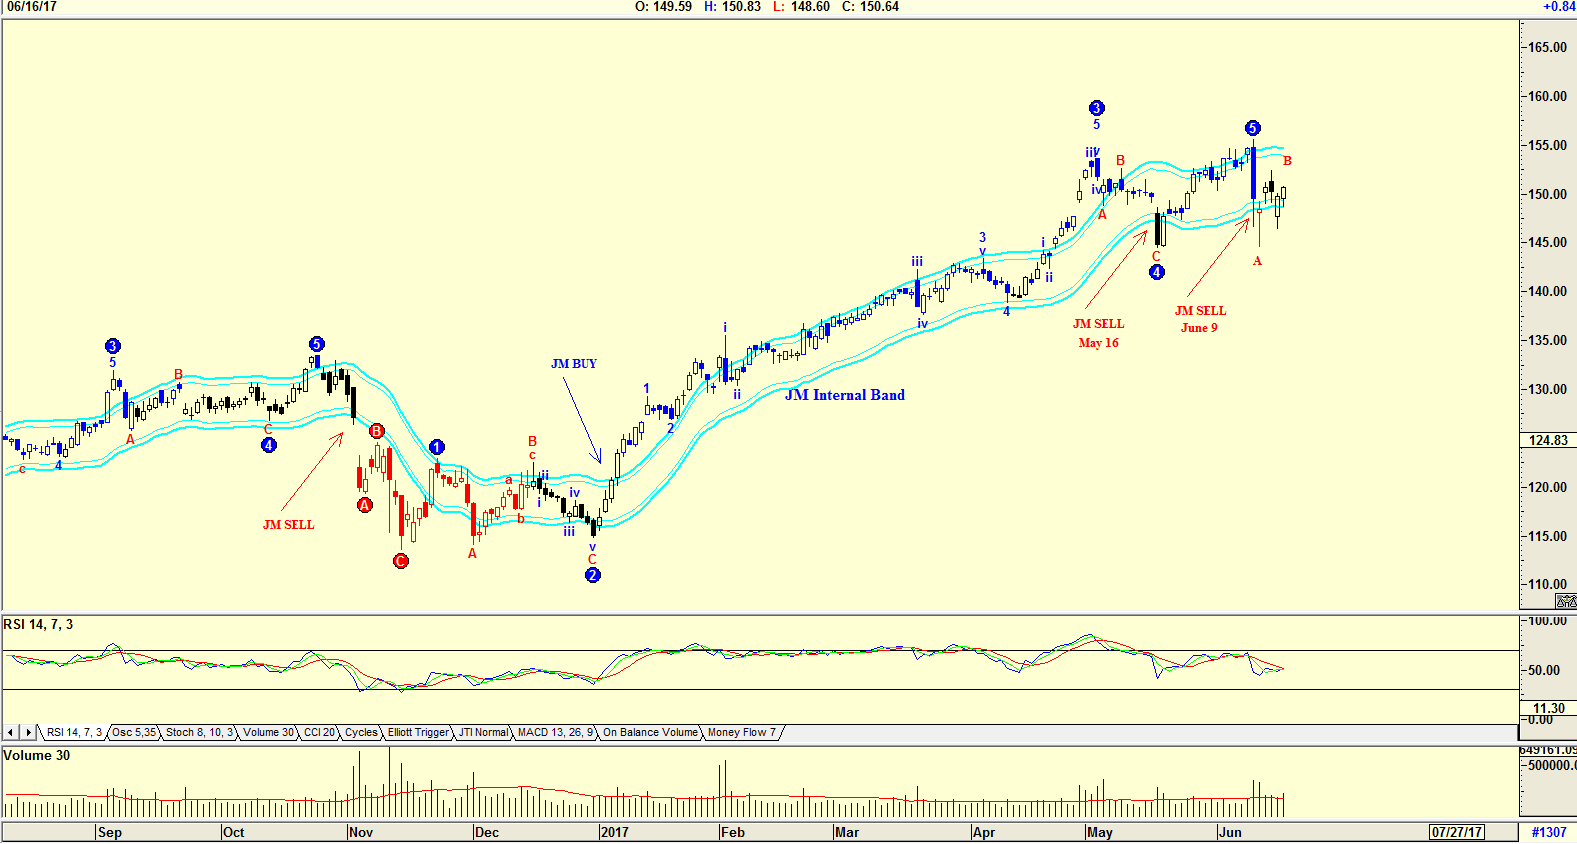
| Figure 1. Facebook. |
| Graphic provided by: AdvancedGET. |
| |
| The chart in Figure 1 is a daily chart of Facebook with an Elliott wave count suggesting that the share price may have completed a WAVE 5 and is now falling in an ABC correction. The share price broke below the lower band of the JM Internal Band on May 16 and June 9 suggesting sell signals. This is confirmed by the RSI indicator which is trending down. The JM Internal Band is a 15-period simple moving average offset by 2% plus and 2% negative. A move above the upper band suggests a buy, and below the lower band a sell. |

|
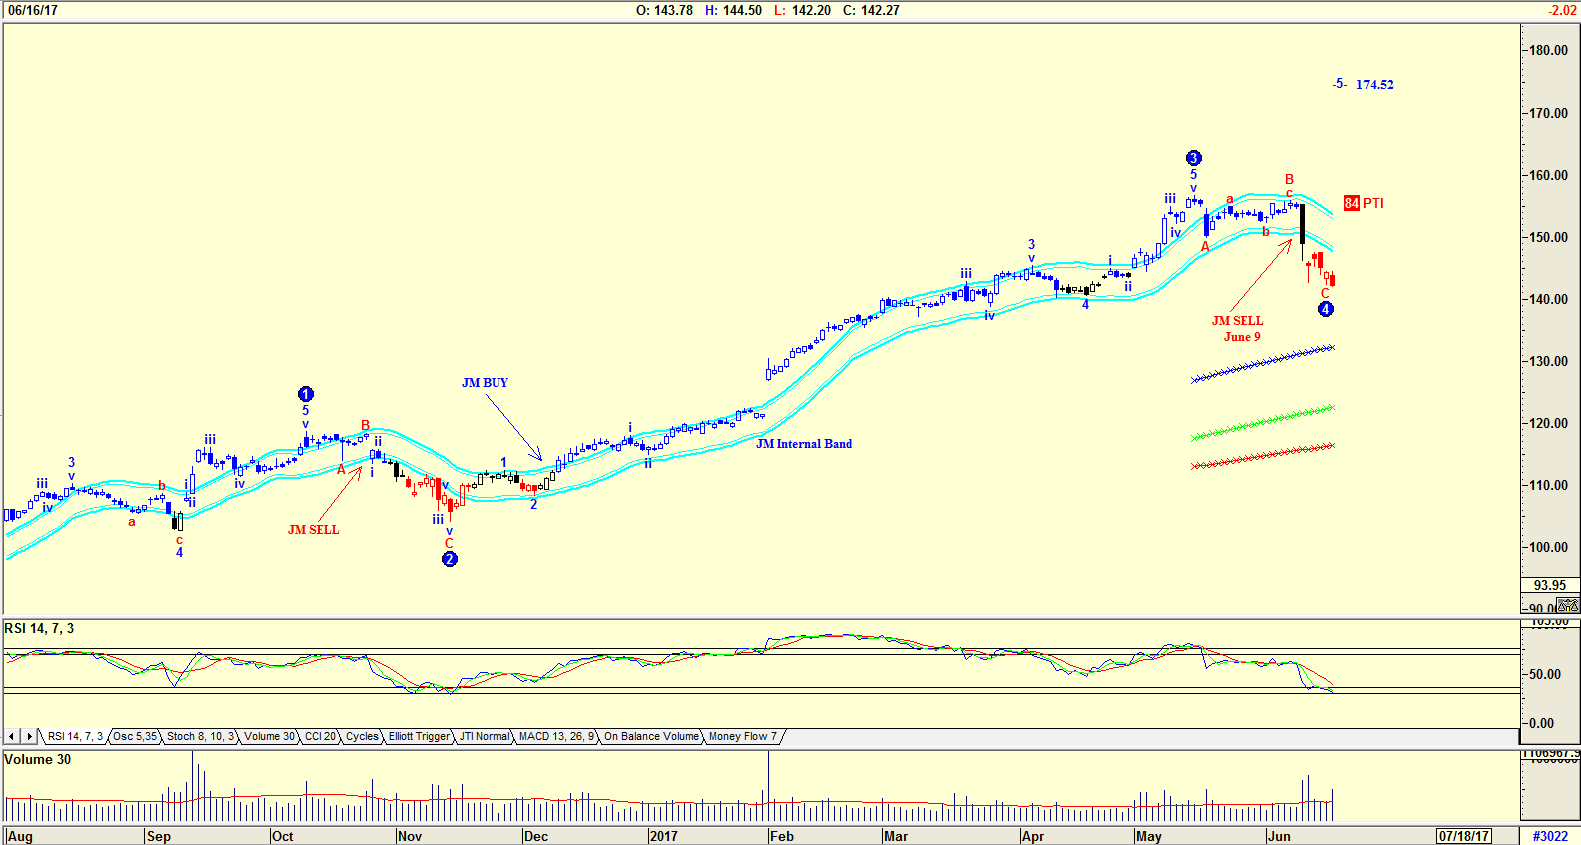
| Figure 2. Apple. |
| Graphic provided by: AdvancedGET. |
| |
| The chart in Figure 2 is a daily chart of the share, Apple with an Elliott wave count suggesting that the share price is in a WAVE 4 correction. The chart is suggesting a WAVE 5 target of 174.52. The PTI (Probability Index) is 84, suggesting that there is an 84% chance of this happening. The RSI index is approaching the buy level, and could reverse, breaking the moving average (red line) and confirming a buy. Volume on the recent correction, however, is above average, suggesting further weakness. The JM Internal Band gave a sell signal on June 9. |

|
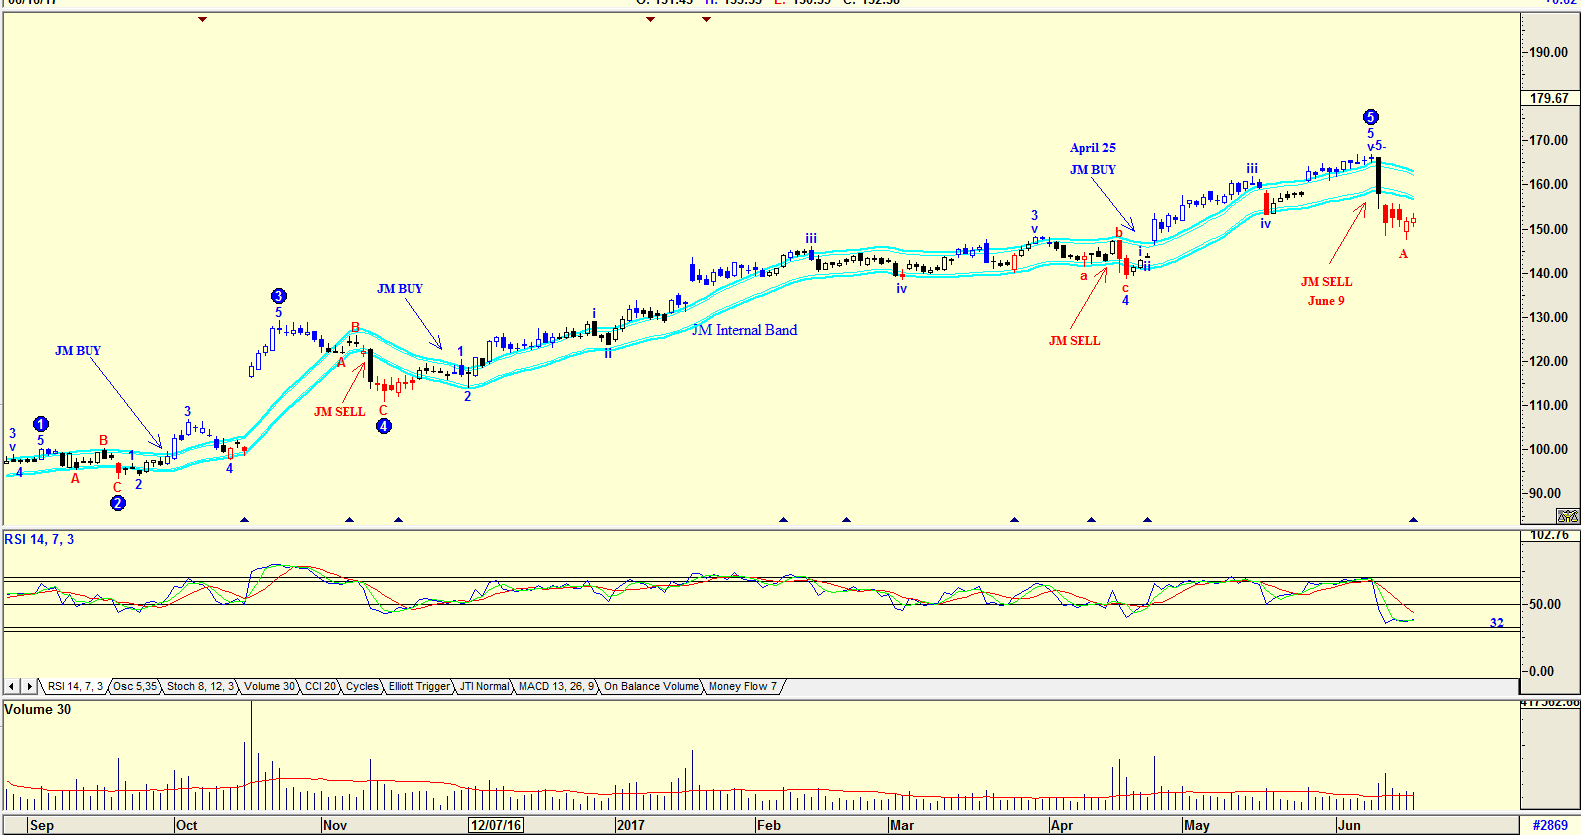
| Figure 3. Netflix. |
| Graphic provided by: AdvancedGET. |
| |
| The chart in Figure 3 is a daily chart of Netflix with an Elliott wave count suggesting that the share price has completed a WAVE 5 and a WAVE A correction. The JM Internal Band once again gave a sell signal on June 9. The RSI indicator has fallen as shown, but has not fallen below the 32-horizontal line, suggesting that there could be more weakness ahead. |

|
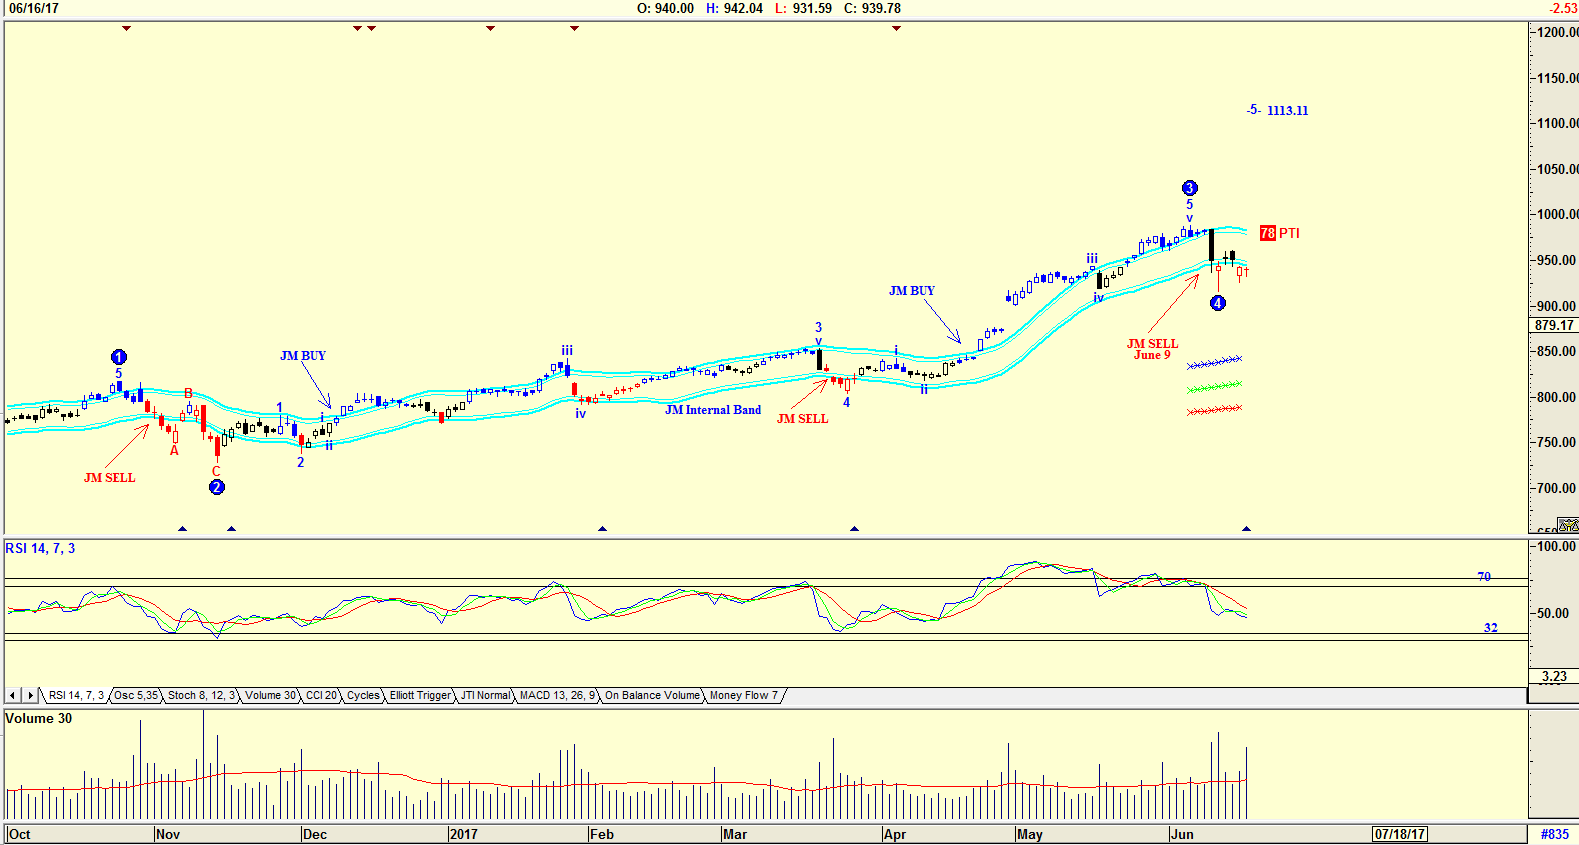
| Figure 4. Google. |
| Graphic provided by: AdvancedGET. |
| |
| The chart in Figure 4 is a chart of Google Class C, with an Elliott wave count in a WAVE 4 correction. The chart is suggesting, with a PTI of 78, that the share price could rise to 1113.11 in WAVE 5. The RSI indicator is falling, suggesting further weakness. Volume as the share price fell is above average suggesting further weakness ahead. Once again, on June 9 the JM Internal Band indicator gave a sell signal. All four of the FANG shares are suggesting weakness which could be bottoming in the future, an exact date is not known. Cautious investors could wait for the share price to move above the upper band of the JM Internal Band before buying. With American political uncertainty slowly increasing, this may be some time ahead. FANG stocks are a guide so be careful out there. |
Has been a technical analyst since 1969, and has worked as a futures and options trader with First Financial Futures in Johannesburg, South Africa.
| Address: | 3256 West 24th Ave |
| Vancouver, BC | |
| Phone # for sales: | 6042634214 |
| E-mail address: | petroosp@gmail.com |
Click here for more information about our publications!
PRINT THIS ARTICLE

Request Information From Our Sponsors
- StockCharts.com, Inc.
- Candle Patterns
- Candlestick Charting Explained
- Intermarket Technical Analysis
- John Murphy on Chart Analysis
- John Murphy's Chart Pattern Recognition
- John Murphy's Market Message
- MurphyExplainsMarketAnalysis-Intermarket Analysis
- MurphyExplainsMarketAnalysis-Visual Analysis
- StockCharts.com
- Technical Analysis of the Financial Markets
- The Visual Investor
- VectorVest, Inc.
- Executive Premier Workshop
- One-Day Options Course
- OptionsPro
- Retirement Income Workshop
- Sure-Fire Trading Systems (VectorVest, Inc.)
- Trading as a Business Workshop
- VectorVest 7 EOD
- VectorVest 7 RealTime/IntraDay
- VectorVest AutoTester
- VectorVest Educational Services
- VectorVest OnLine
- VectorVest Options Analyzer
- VectorVest ProGraphics v6.0
- VectorVest ProTrader 7
- VectorVest RealTime Derby Tool
- VectorVest Simulator
- VectorVest Variator
- VectorVest Watchdog
