HOT TOPICS LIST
- MACD
- Fibonacci
- RSI
- Gann
- ADXR
- Stochastics
- Volume
- Triangles
- Futures
- Cycles
- Volatility
- ZIGZAG
- MESA
- Retracement
- Aroon
INDICATORS LIST
LIST OF TOPICS
PRINT THIS ARTICLE
by Koos van der Merwe
Gold is regarded by many as a safe haven when the stock market collapses.
Position: Sell
Koos van der Merwe
Has been a technical analyst since 1969, and has worked as a futures and options trader with First Financial Futures in Johannesburg, South Africa.
PRINT THIS ARTICLE
TECHNICAL ANALYSIS
Where Is Gold Going?
06/21/17 04:29:56 PMby Koos van der Merwe
Gold is regarded by many as a safe haven when the stock market collapses.
Position: Sell
| A safe haven asset is looked for in times of market stress or turmoil. A safe haven asset should not be confused with a hedge fund. A safe haven is negatively correlated with another asset and protects investors during a stock market crises, whereas a hedge fund protects an investor when the market is behaving normally. Gold, as a safe haven asset, is commonly bought in times of financial or political uncertainty, because gold is not at risk of becoming worthless unlike other assets, which carry a credit risk. History has shown that gold works as a safe haven for stocks, but not for bonds, and works for a limited time only, usually around 15 trading days. Investors are inclined to buy gold on days of extreme negativity, and sell gold when they regain confidence in the stock market. One should not forget that investing in gold does carry risk, whereas other safe haven assets such as government bonds carry far less risk. With the present uncertainty in the United States political system, many investors were looking to gold to protect their assets, however, on Friday, June 10, gold gave me a sell signal on my charts. Are these sell signals genuine? Let us look at the charts. |

|
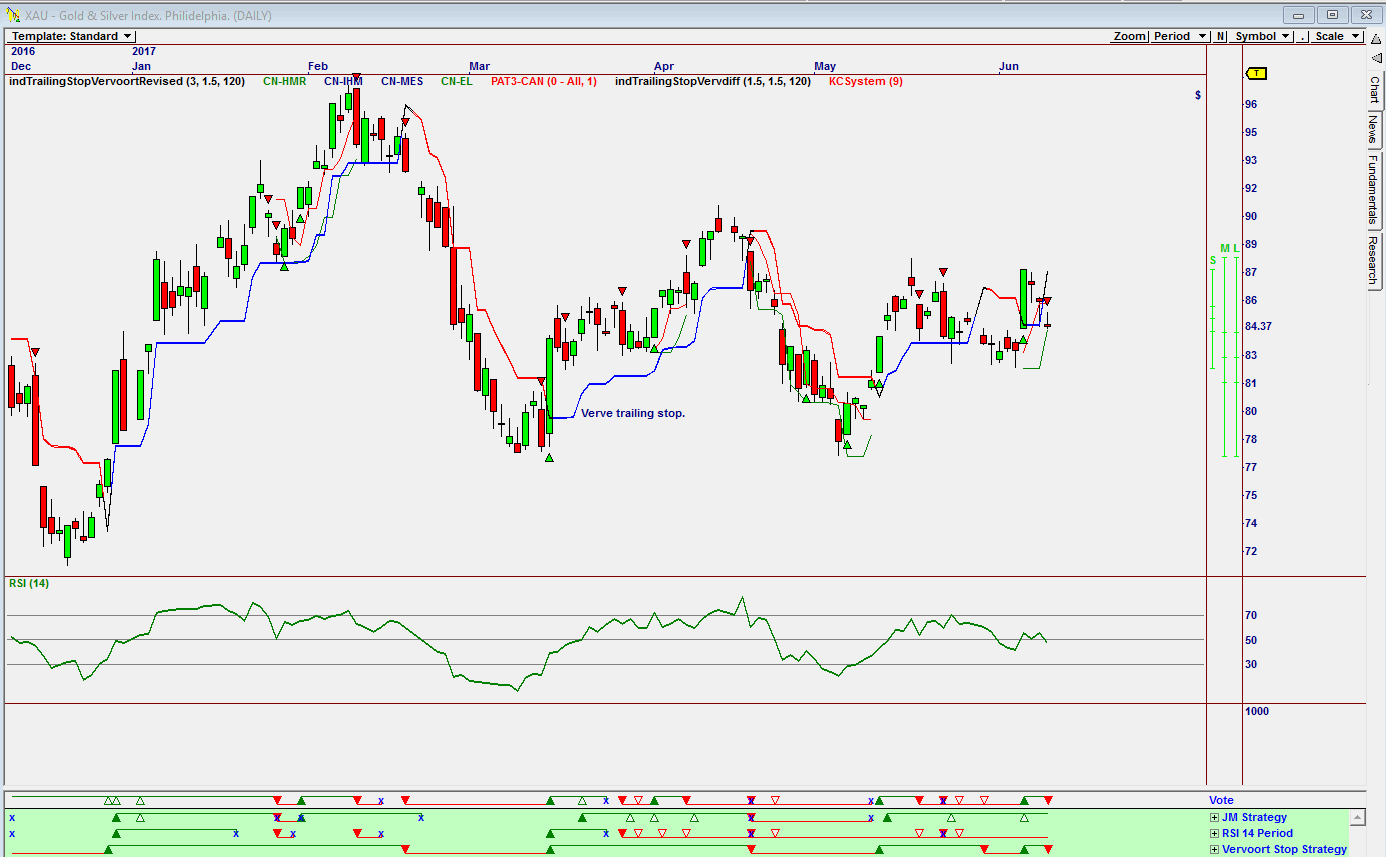
| Figure 1. Daily Omnitrader Chart Of XAU. |
| Graphic provided by: Omnitrader. |
| |
| The chart in Figure 1 is a daily Omnitrader chart of the Gold and Silver Index, XAU. The chart shows a sell signal on the Vote line based on the Vervoort Stop Strategy in combination with the RSI-14 Period Strategy. Do note the RSI indicator which is trending down. |

|
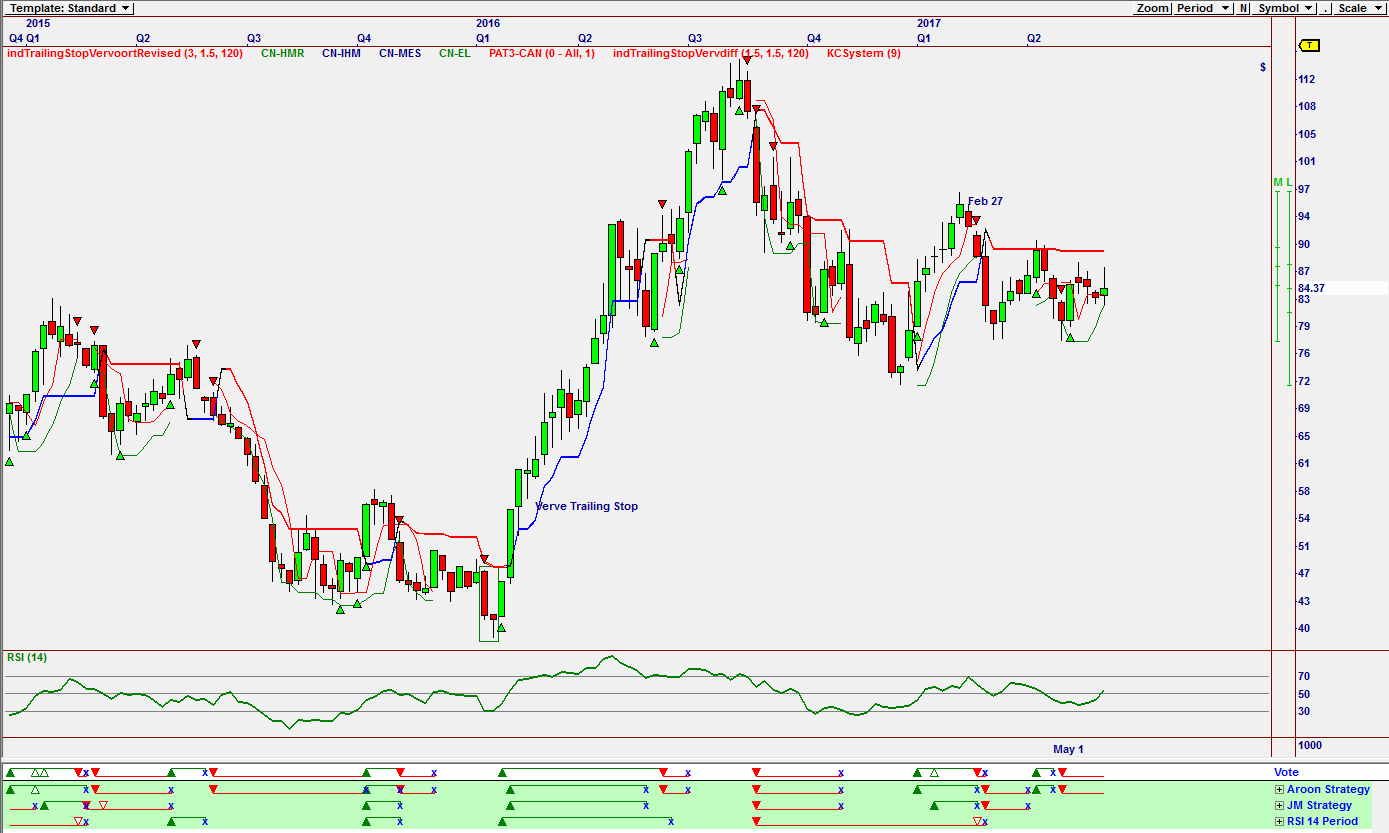
| Figure 2. Weekly Omnitrader Chart Of XAU. |
| Graphic provided by: Omnitrader. |
| |
| The chart in Figure 2 is a weekly chart showing a Vote line sell based on the Aroon Strategy. The signal was given on May 1. Do note that the share price broke below the Verve trailing stop on February 27, suggesting weakness. |

|
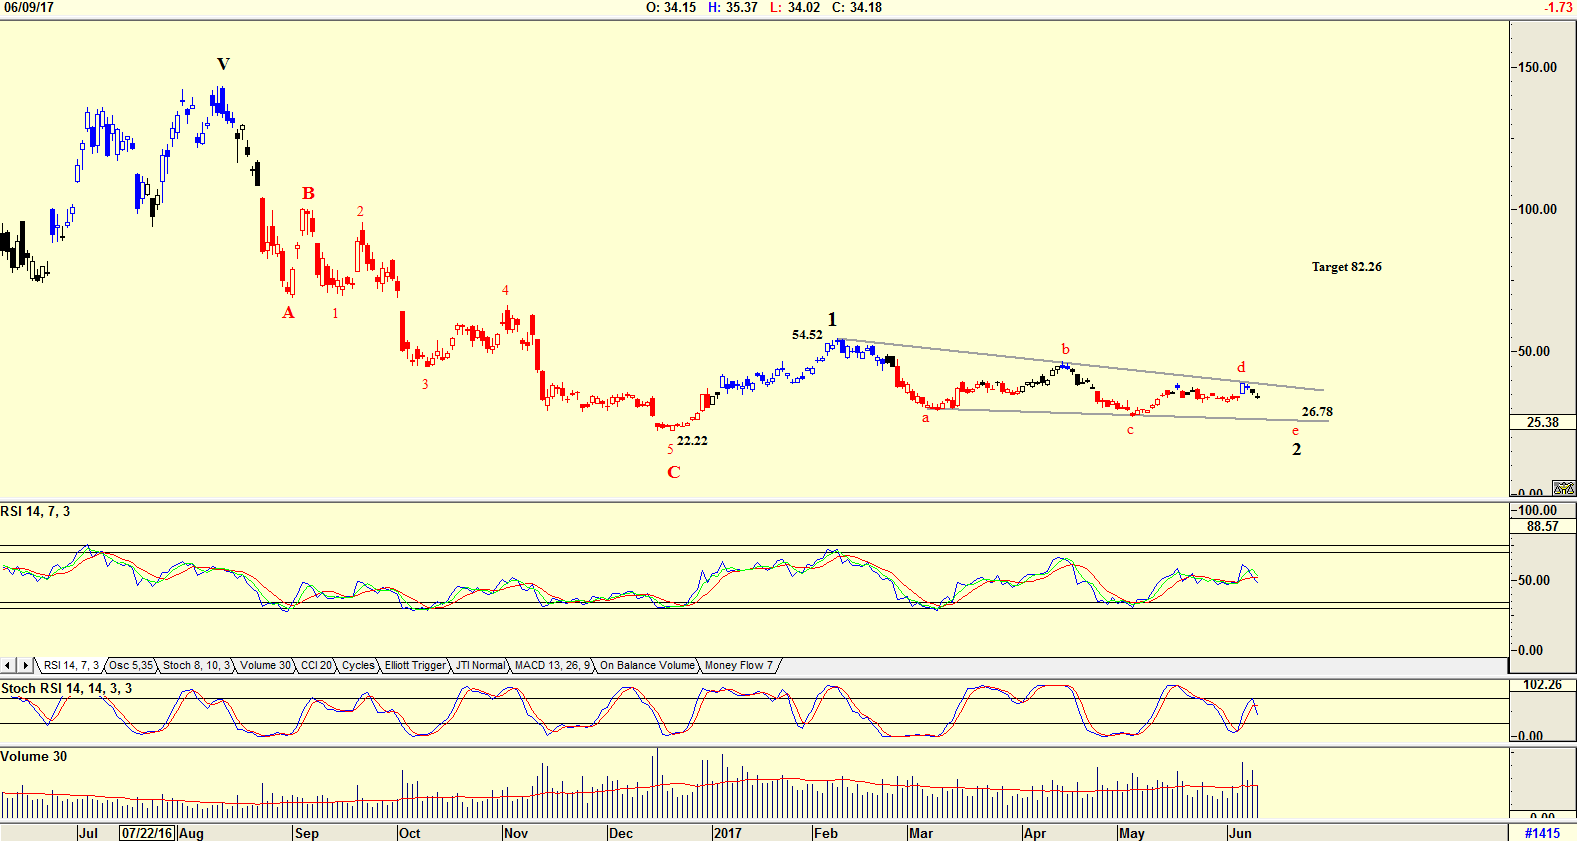
| Figure 3. Daily Chart Of NUGT. |
| Graphic provided by: AdvancedGET. |
| |
| The chart in Figure 3 is an Advanced GET chart of Direxion Gold Mining Bull (NUGT). The Direxion Daily Gold Miners Bull Index (NUGT) is a 3x leveraged ETF that should be used for short term trades only. They are a powerful tool that magnifies movement. The chart shows an Elliott wave count suggesting that the share price is in a prolonged Wave 2 correction of a bull trend. The share price could fall to $26.78, the support level of the diagonal triangle that has formed. The diagonal triangle suggests that the share price, when it has completed wave c of Wave 2, could rise in a Wave 3 to $82 26. (54.52 - 26.78 = 27.74 + 54.52 = 82.26).Do note that both the RSI and Stochastic RSI indexes are bullish. Yes, the American political system is unfortunately very uncertain at the moment, with the approval rating of President Donald Trump having fallen to 34% at the time of writing this article. This rating is the lowest achieved by any President with the first 6 months of their Presidency. The chart is also suggesting that once Wave 2 is complete, and NUGT starts rising, the share market could start correcting as predicted by many experts out there. The "Sell in May" mantra could become the "Swoon in June", so caution is very necessary — a strong reason for investing in gold. |
Has been a technical analyst since 1969, and has worked as a futures and options trader with First Financial Futures in Johannesburg, South Africa.
| Address: | 3256 West 24th Ave |
| Vancouver, BC | |
| Phone # for sales: | 6042634214 |
| E-mail address: | petroosp@gmail.com |
Click here for more information about our publications!
PRINT THIS ARTICLE

Request Information From Our Sponsors
- StockCharts.com, Inc.
- Candle Patterns
- Candlestick Charting Explained
- Intermarket Technical Analysis
- John Murphy on Chart Analysis
- John Murphy's Chart Pattern Recognition
- John Murphy's Market Message
- MurphyExplainsMarketAnalysis-Intermarket Analysis
- MurphyExplainsMarketAnalysis-Visual Analysis
- StockCharts.com
- Technical Analysis of the Financial Markets
- The Visual Investor
- VectorVest, Inc.
- Executive Premier Workshop
- One-Day Options Course
- OptionsPro
- Retirement Income Workshop
- Sure-Fire Trading Systems (VectorVest, Inc.)
- Trading as a Business Workshop
- VectorVest 7 EOD
- VectorVest 7 RealTime/IntraDay
- VectorVest AutoTester
- VectorVest Educational Services
- VectorVest OnLine
- VectorVest Options Analyzer
- VectorVest ProGraphics v6.0
- VectorVest ProTrader 7
- VectorVest RealTime Derby Tool
- VectorVest Simulator
- VectorVest Variator
- VectorVest Watchdog
