HOT TOPICS LIST
- MACD
- Fibonacci
- RSI
- Gann
- ADXR
- Stochastics
- Volume
- Triangles
- Futures
- Cycles
- Volatility
- ZIGZAG
- MESA
- Retracement
- Aroon
INDICATORS LIST
LIST OF TOPICS
PRINT THIS ARTICLE
by Koos van der Merwe
When a stock goes up and up and up, when can one expect a down?
Position: Accumulate
Koos van der Merwe
Has been a technical analyst since 1969, and has worked as a futures and options trader with First Financial Futures in Johannesburg, South Africa.
PRINT THIS ARTICLE
ELLIOTT WAVE
Amazon
06/07/17 04:27:33 PMby Koos van der Merwe
When a stock goes up and up and up, when can one expect a down?
Position: Accumulate
| Amazon.com was founded on July 5th, 1994, by Jeff Bezos. The company is based in Seattle, Washington. Today, it is the largest internet company by revenue. Just about everyone I know has purchased from Amazon. Yes, prices are cheaper than a store, but the attraction is also that one does not have to leave home to make a purchase. With one's computer, browsing through Amazon pages is fascinating, and finding what one is looking for is not at all difficult. The success of Amazon is, however, harming the retail store industry. There are many stores not succeeding and owners of buildings are starting to find it difficult to find a tenant when its present tenant leaves because of lack of business. The question of course on every investor's mind is, "How long can this last?" |

|
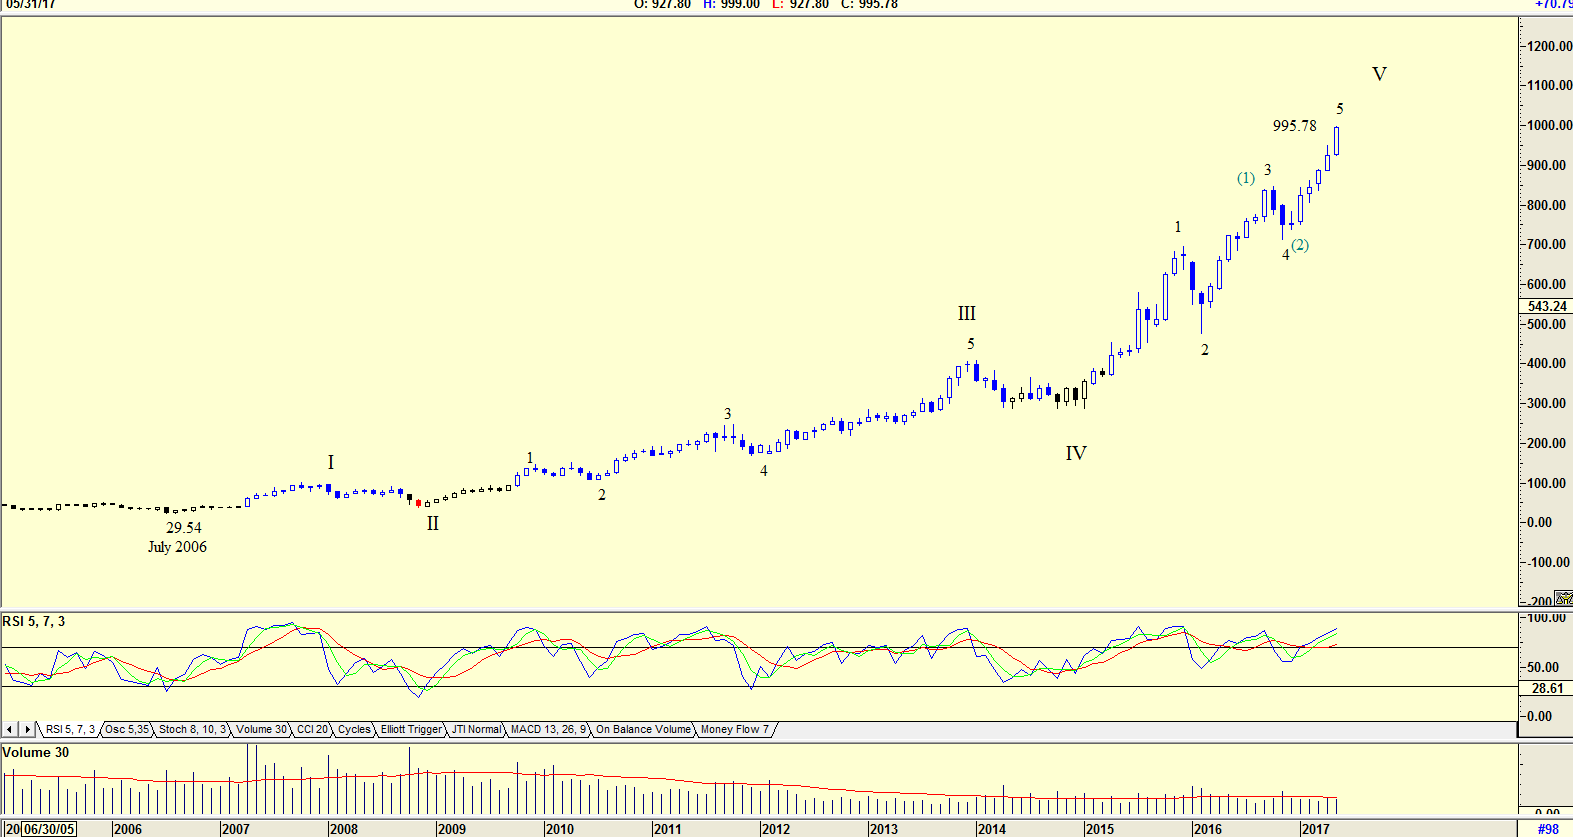
| Figure 1. Monthly chart with Elliot wave count. |
| Graphic provided by: AdvancedGET. |
| |
| The chart in Figure 1 is a monthly chart showing how the share price rose from $29.54 in July 2006 to its present price of $995.78. An Elliott wave count suggests that the share price is in a WAVE V. What is a concern, looking at the chart, is that Wave 1 of WAVE V is greater than Wave 3 of WAVE V. When this occurs, then Wave 5 of WAVE V should be less than Wave 3 of WAVE V. This means that a correction should be on the cards in the near future. However, should this not happen, then Wave 3 of WAVE V becomes Wave (1) of Wave 1 of WAVE V, with Wave 4 of WAVE V becoming Wave (2) of Wave 3 of WAVE V. This suggests that the share price will break above the 1000 level and go even higher. The RSI indicator is, and has been for some time now, at overbought levels, but seems to have failed in giving a definite sell signal. Volume has been consistent. |

|
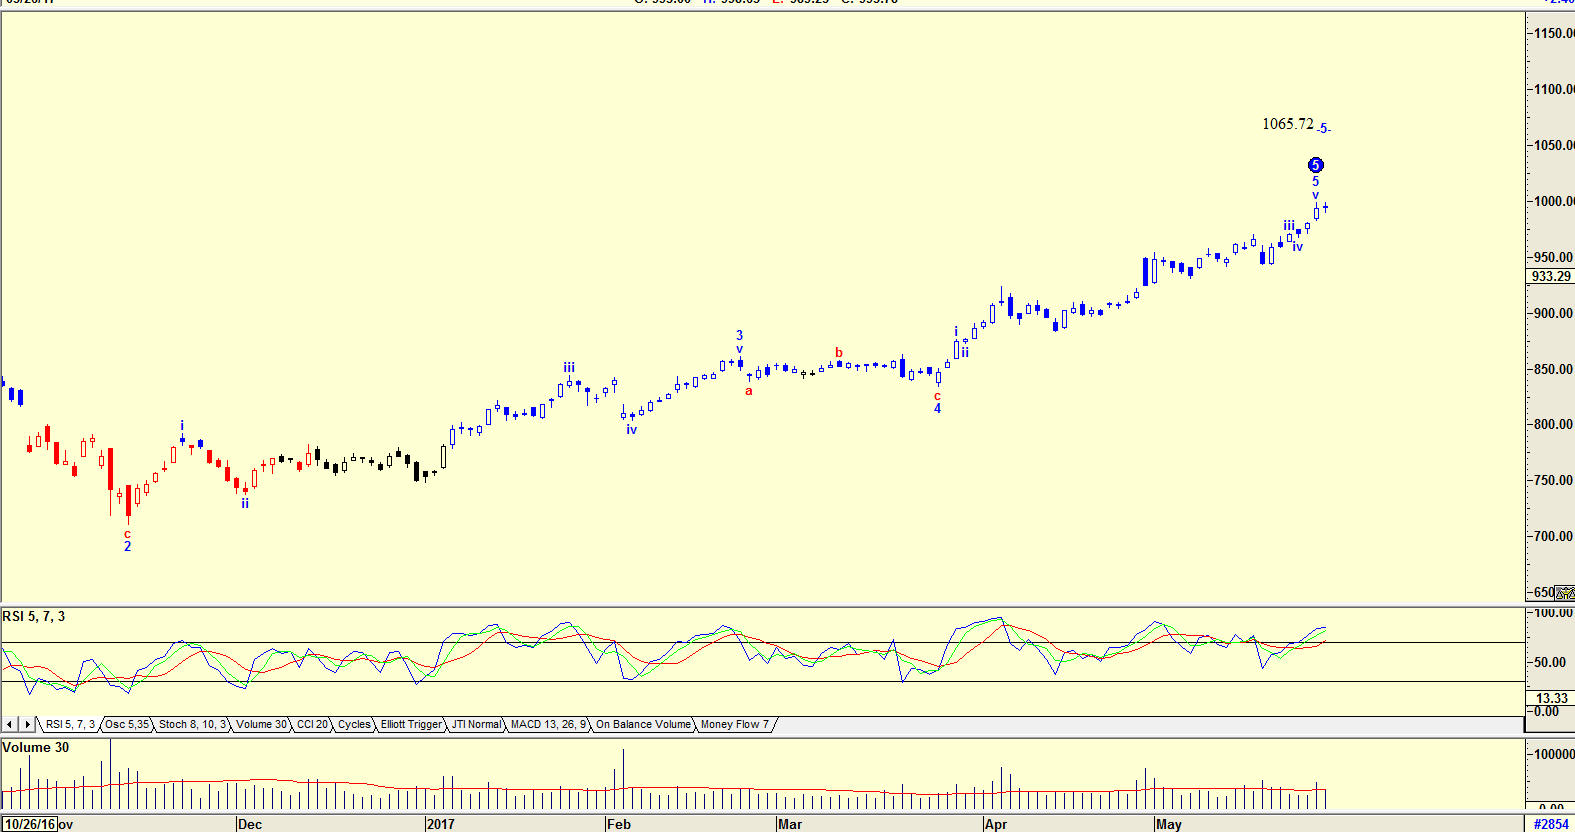
| Figure 2. Daily chart with Elliott wave count. |
| Graphic provided by: AdvancedGET. |
| |
| The daily chart in Figure 2 has an Elliott wave count suggesting that the share price could rise to 1065.72 before correcting. Is this forecasting incredible sales prior to Christmas or is it simply the "Sell in May" doctrine. Whatever the case, buying Amazon shares with the RSI at overbought levels is risky. |

|
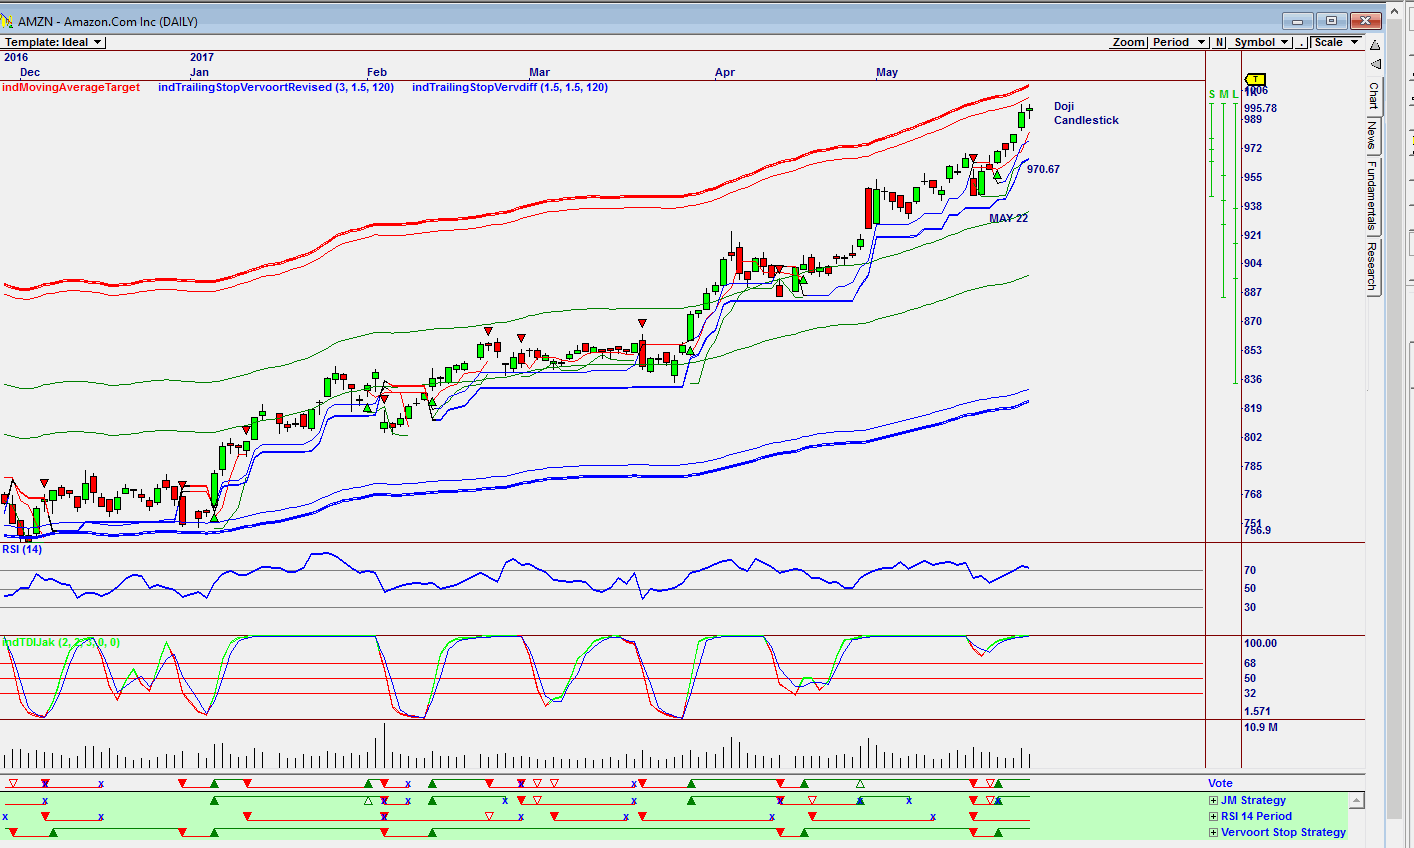
| Figure 3. Omnitrader Daily Chart. |
| Graphic provided by: Omnitrader. |
| |
| The chart in figure 3 is an Omnitrader Daily chart where the Vote line gave a buy on May 22, when the share price was $970.67. The buy signal on the Vote line was based on the JM Strategy and Vervoort Stop Strategy. Do note that both the RSI(14) and TD Jak indicators are both at overbought levels. The DOJI Candlestick is a pattern suggesting indecision at a market top. Too many well-known investors are calling for a major correction in the stock market, a correction that is simply not happening. Will the "Sell in May" mantra, and a correction in Amazon should and when it does occur be the trigger to that correction? With the share price testing the upper band shown in the chart in Figure 3, and with the "Sell in May" mantra on everyone's lips, this could well occur. However, charts in Figure 1 and Figure 2 suggest that any correction that does occur will not be the trigger to a collapse in the stock market. That collapse has to come from a source other than the retail buyer. |
Has been a technical analyst since 1969, and has worked as a futures and options trader with First Financial Futures in Johannesburg, South Africa.
| Address: | 3256 West 24th Ave |
| Vancouver, BC | |
| Phone # for sales: | 6042634214 |
| E-mail address: | petroosp@gmail.com |
Click here for more information about our publications!
PRINT THIS ARTICLE

Request Information From Our Sponsors
- StockCharts.com, Inc.
- Candle Patterns
- Candlestick Charting Explained
- Intermarket Technical Analysis
- John Murphy on Chart Analysis
- John Murphy's Chart Pattern Recognition
- John Murphy's Market Message
- MurphyExplainsMarketAnalysis-Intermarket Analysis
- MurphyExplainsMarketAnalysis-Visual Analysis
- StockCharts.com
- Technical Analysis of the Financial Markets
- The Visual Investor
- VectorVest, Inc.
- Executive Premier Workshop
- One-Day Options Course
- OptionsPro
- Retirement Income Workshop
- Sure-Fire Trading Systems (VectorVest, Inc.)
- Trading as a Business Workshop
- VectorVest 7 EOD
- VectorVest 7 RealTime/IntraDay
- VectorVest AutoTester
- VectorVest Educational Services
- VectorVest OnLine
- VectorVest Options Analyzer
- VectorVest ProGraphics v6.0
- VectorVest ProTrader 7
- VectorVest RealTime Derby Tool
- VectorVest Simulator
- VectorVest Variator
- VectorVest Watchdog
