HOT TOPICS LIST
- MACD
- Fibonacci
- RSI
- Gann
- ADXR
- Stochastics
- Volume
- Triangles
- Futures
- Cycles
- Volatility
- ZIGZAG
- MESA
- Retracement
- Aroon
INDICATORS LIST
LIST OF TOPICS
PRINT THIS ARTICLE
by Koos van der Merwe
So, are you a Netflix fan? If yes, would you buy the share?
Position: Sell
Koos van der Merwe
Has been a technical analyst since 1969, and has worked as a futures and options trader with First Financial Futures in Johannesburg, South Africa.
PRINT THIS ARTICLE
TECHNICAL ANALYSIS
Watching Netflix
05/31/17 02:59:07 PMby Koos van der Merwe
So, are you a Netflix fan? If yes, would you buy the share?
Position: Sell
| Netflix was founded by Reed Hastings and Marc Randolph on August 29, 1997, in Scotts Valley, California. Choosing a movie to watch on TV at home, without having to drive down to a store that sells movies on a CD, walking through the store, hoping that the movie you want to watch has not been taken by another customer. So, if you watch a Netflix movie, or have become addicted to a movie series produced by Netflix, would you consider buying the share? |

|
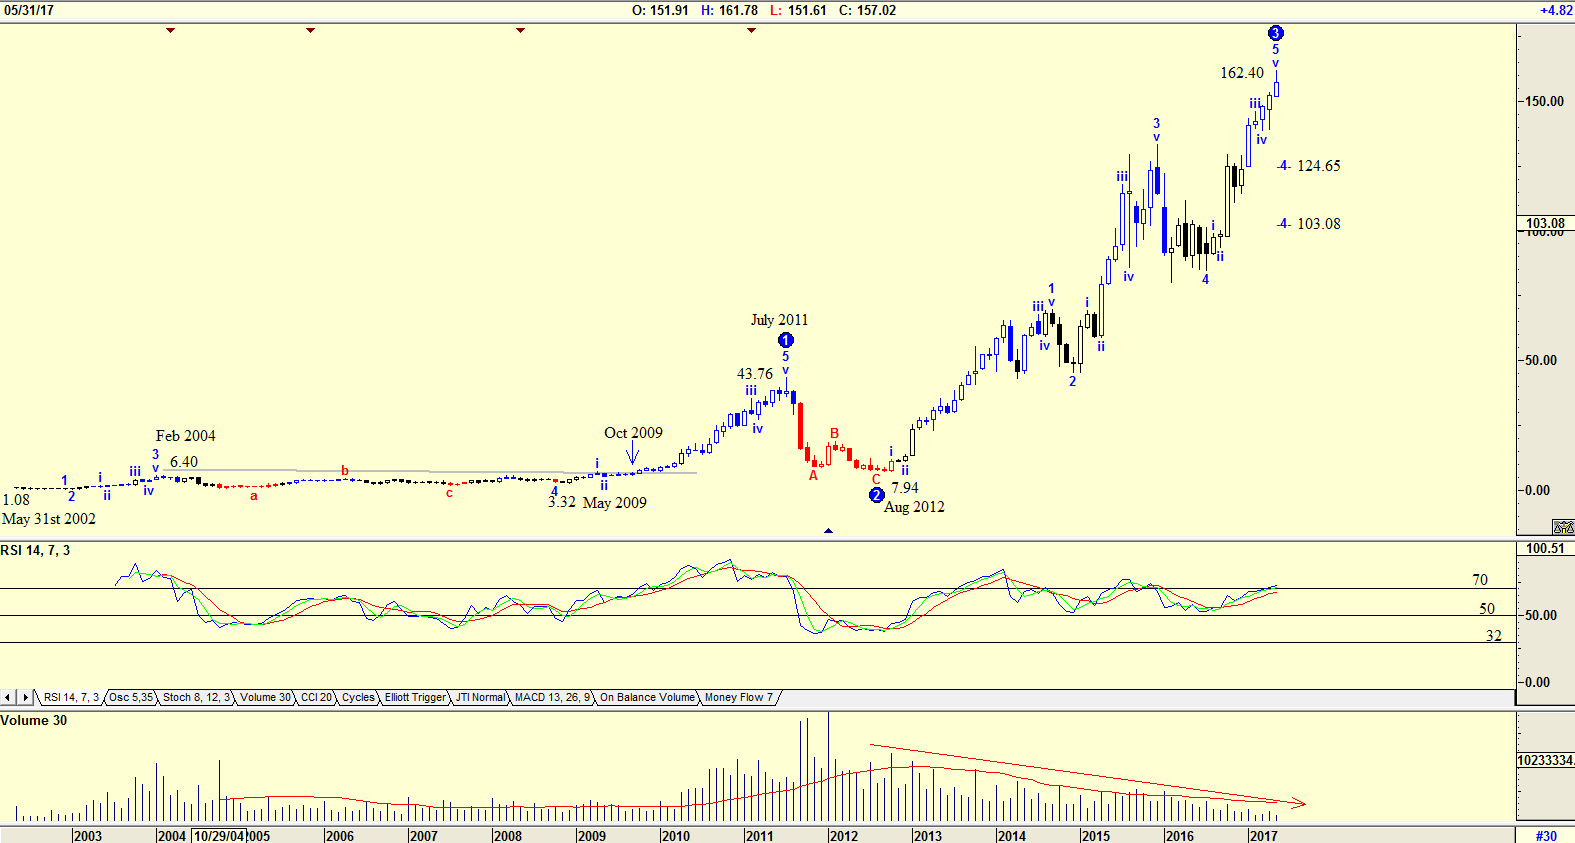
| Figure 1. Monthly chart with Elliott wave count. |
| Graphic provided by: AdvancedGET. |
| |
| On May 31, 2002, Netflix shares traded at $1.08 and rose to $6.40 by February 2004. For the next five years, the share price traded in the range between $3.32 and $6.40, then, in October 2009, the share price broke above the $6.40 resistance level and rose in a WAVE 1 to $43.76 by July 2011. The share price continued rising in a minor 5 wave Elliott count and is currently completing a wave 5 of WAVE 3 at $162.40. The RSI indicator is at overbought levels, but the chart shows that the RSI indicator never once fell to the 32 level to trigger a buy. It used the 50 horizontal as its trigger. The chart also shows how volume fell as the share price rose, but that is to be expected as less traders traded the share at a higher price. |

|
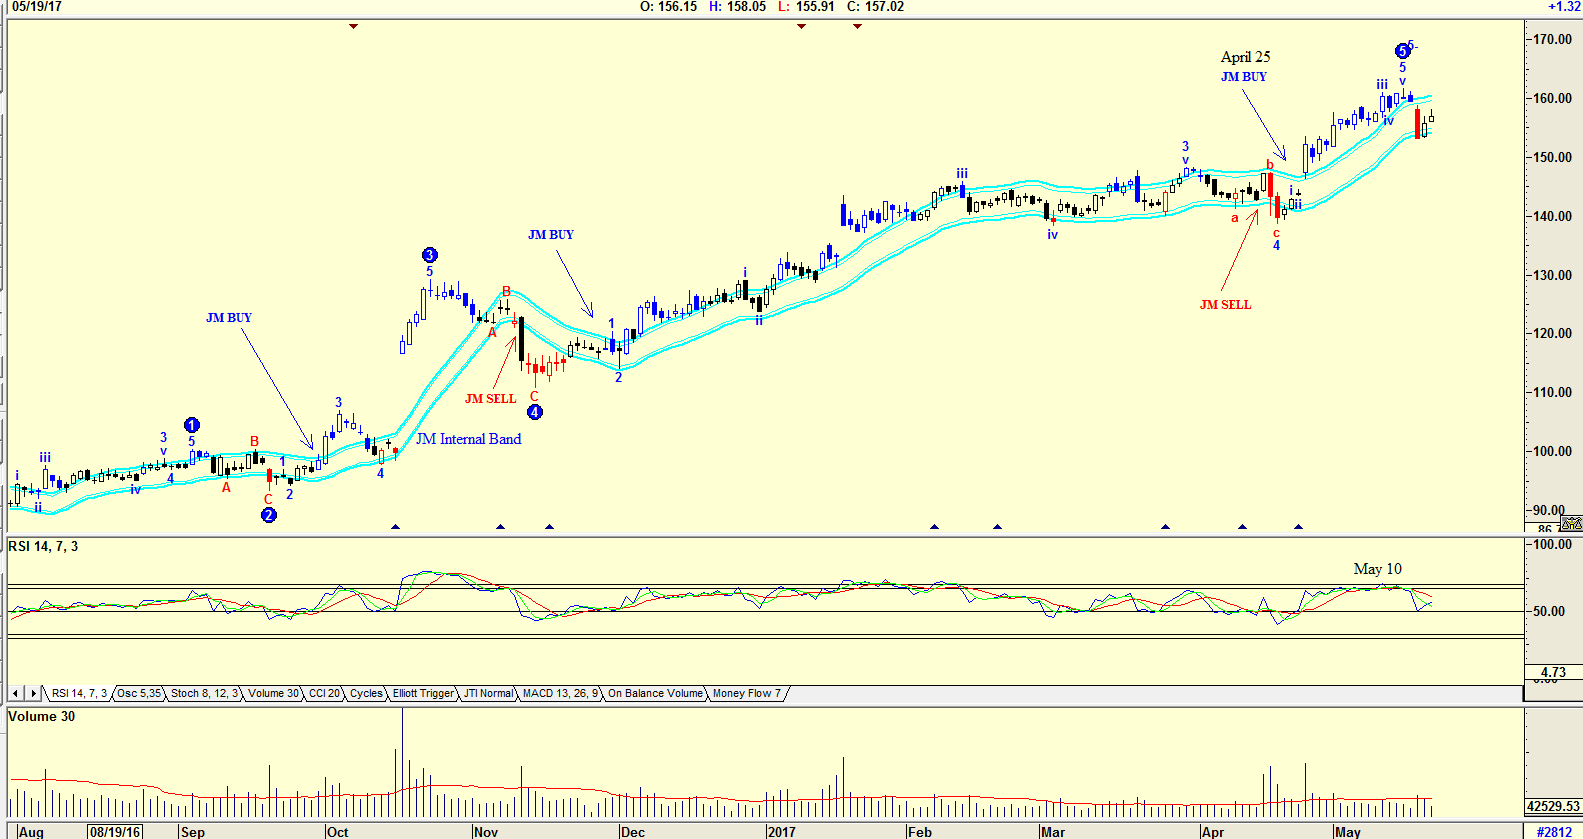
| Figure 2. Daily chart with JM internal band. |
| Graphic provided by: AdvancedGET. |
| |
| The daily chart in Figure 2 has an Elliott wave count suggesting that the share price is in a WAVE 5. The chart shows that the share price gave a JM buy on April 25 when the share price broke above the upper band. The JM internal band is a 15-period simple moving average offset by 2% plus and 2% negative. A move above the upper band suggests a buy and below the lower band, a sell. The share price has dropped to test the lower band, but did not fall below it suggesting a sell. Do note that the RSI indicator did suggest a sell on May 10th. I would not be a buyer of the share at the present price, but would rather wait for the RSI to fall below the 50 horizontal when it is possible that a JM internal band sell could be triggered. This is a share definitely on my watch list, especially with the Trumponian "House of Cards" affecting the market. |
Has been a technical analyst since 1969, and has worked as a futures and options trader with First Financial Futures in Johannesburg, South Africa.
| Address: | 3256 West 24th Ave |
| Vancouver, BC | |
| Phone # for sales: | 6042634214 |
| E-mail address: | petroosp@gmail.com |
Click here for more information about our publications!
PRINT THIS ARTICLE

Request Information From Our Sponsors
- StockCharts.com, Inc.
- Candle Patterns
- Candlestick Charting Explained
- Intermarket Technical Analysis
- John Murphy on Chart Analysis
- John Murphy's Chart Pattern Recognition
- John Murphy's Market Message
- MurphyExplainsMarketAnalysis-Intermarket Analysis
- MurphyExplainsMarketAnalysis-Visual Analysis
- StockCharts.com
- Technical Analysis of the Financial Markets
- The Visual Investor
- VectorVest, Inc.
- Executive Premier Workshop
- One-Day Options Course
- OptionsPro
- Retirement Income Workshop
- Sure-Fire Trading Systems (VectorVest, Inc.)
- Trading as a Business Workshop
- VectorVest 7 EOD
- VectorVest 7 RealTime/IntraDay
- VectorVest AutoTester
- VectorVest Educational Services
- VectorVest OnLine
- VectorVest Options Analyzer
- VectorVest ProGraphics v6.0
- VectorVest ProTrader 7
- VectorVest RealTime Derby Tool
- VectorVest Simulator
- VectorVest Variator
- VectorVest Watchdog
