HOT TOPICS LIST
- MACD
- Fibonacci
- RSI
- Gann
- ADXR
- Stochastics
- Volume
- Triangles
- Futures
- Cycles
- Volatility
- ZIGZAG
- MESA
- Retracement
- Aroon
INDICATORS LIST
LIST OF TOPICS
PRINT THIS ARTICLE
by Koos van der Merwe
Looking back at many popular companies that listed on the exchange, we see that they often dropped in price after their initial listing yet today are soaring.
Position: Sell
Koos van der Merwe
Has been a technical analyst since 1969, and has worked as a futures and options trader with First Financial Futures in Johannesburg, South Africa.
PRINT THIS ARTICLE
TECHNICAL ANALYSIS
Taking A Chance With Snapchat
05/24/17 03:32:01 PMby Koos van der Merwe
Looking back at many popular companies that listed on the exchange, we see that they often dropped in price after their initial listing yet today are soaring.
Position: Sell
| Many popular technical companies that listed on the stock exchange dropped in price after their listing, but soared to highs that have left investors gasping and regretting that they never bought the shares of those companies at their lows. One that comes to mind is Facebook, where the shares listed on the market on May 18, 2012, reaching a high of 45.39, and then dropping to $17.55 by August 30, 2012. With the share price today at $150.33, buying at the bottom and putting trust in the management would have left one with a comfortable profit. One share that failed badly is GoPro, which listed in June 2014 at $29.06, rose strongly to $98.47 by October 2014, and today is trading at $8.54. The question therefore is what with Snapchat? Is it worth taking a gamble that the share price could be another Facebook? |

|
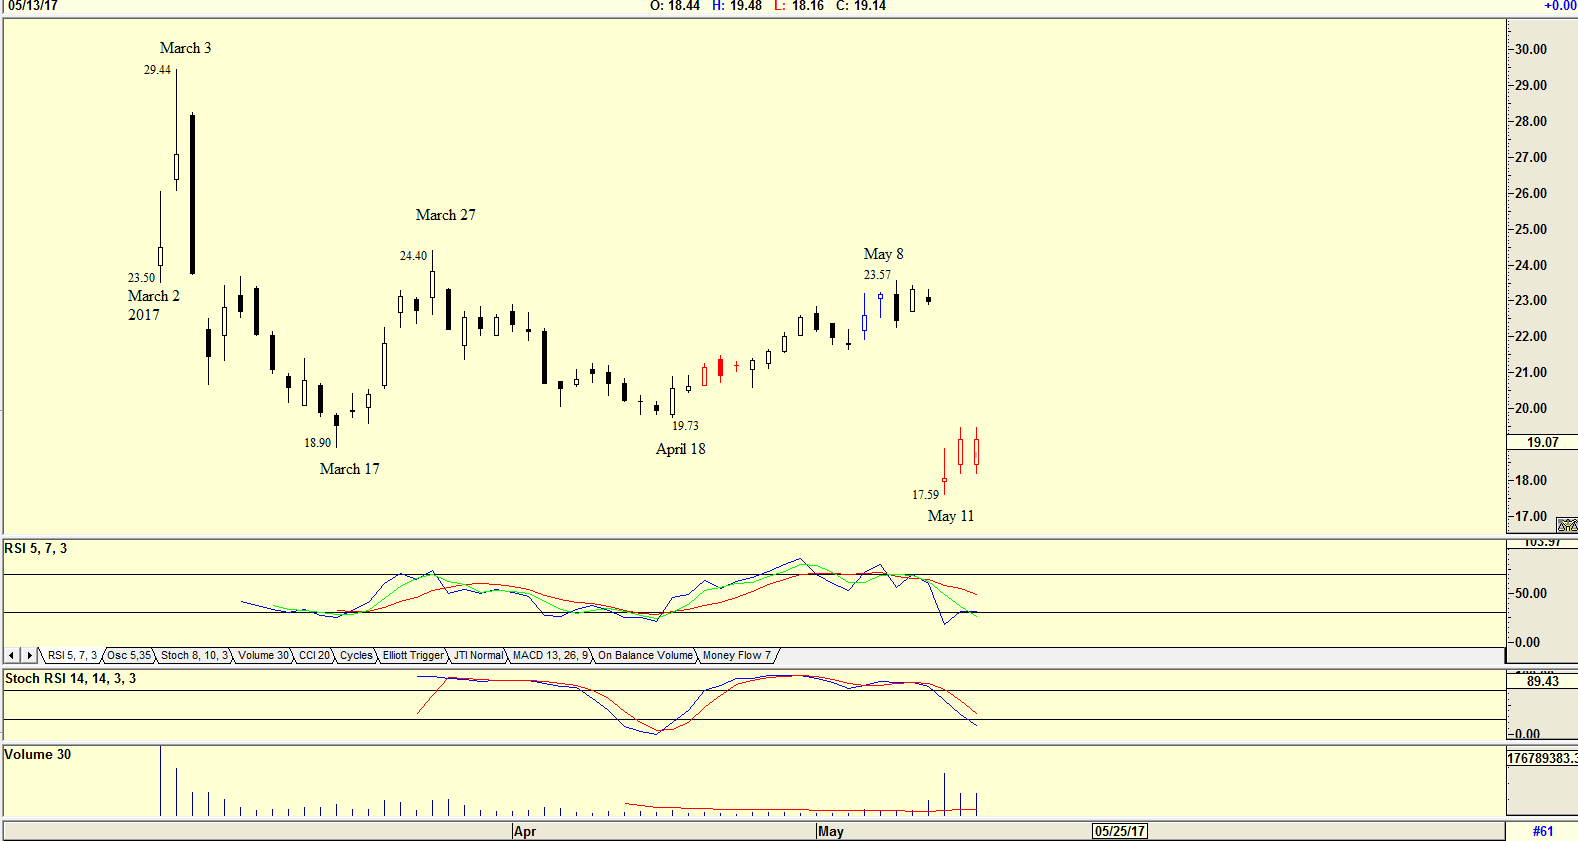
| Figure 1. Daily chart for SNAP. |
| Graphic provided by: AdvancedGET. |
| |
| The chart in Figure 1 is a daily chart of Snapchat showing how the share price rose strongly with its listing on March 2, 2017, with a low of $23.50, and rising to a high of $29.44 by March 3. The share price then immediately dropped to a low of $18.90 by March 17. From that level, the share price traded between $24.40 and $19.73, and then fell badly to $17.59 on May 11 as financial results were released that were far below expectations. What now? Do you buy the share hoping that it will be another Facebook, and rise strongly to new highs? Looking at the two indicators, the RSI 5 period and the Stochastic RSI 14 period, both are at oversold levels suggesting that the price should start rising. The question is, is the gamble worth taking? |

|
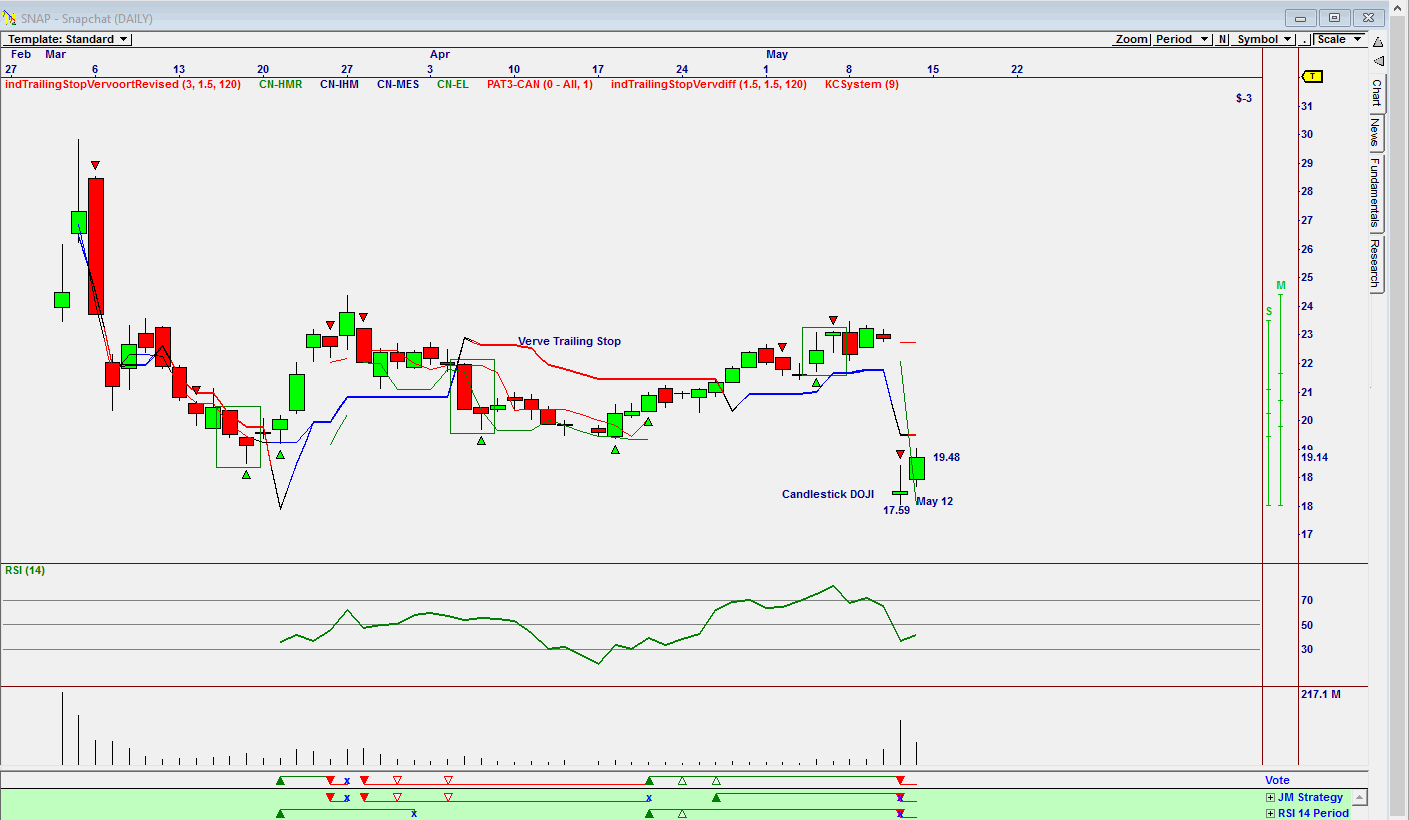
| Figure 2. Daily Omnitrader chart for SNAP. |
| Graphic provided by: Omnitrader. |
| |
| Looking at the Omnitrader chart in Figure 2, we see that the Vote line gave a sell signal based on the JM Strategy and the RSI 14-period strategy. The share price also fell below the Verve trailing stop suggesting a sell. However, the candlestick DOJI does throw a spanner in the works, suggesting that the share price should rise, which it did, and strongly the following day. The DOJI is a well known and important 1-day formation. It is formed when the open and close of a day's trading session are the same or very close. The DOJI is used as a signal to indicate indecision, and one can see how the price rose strongly on May 12 from a low of $17.59 on May 11 to $19.48. Will this trend continue? The Vote line on the chart with both the JM Strategy and the RSI 14-period strategy is negative, and has given a sell. Also, note the RSI 14 indicator suggesting further weakness ahead. Taking a gamble with SNAP shares is very tempting, however will the share be another Facebook and attract millions of members throughout the world or will it be another GoPro? Nibbling at the share is tempting, but the question to ask is, "How many of your friends play with Snapchat?" Is it popular or does it only attract a few players? Look around you for the answer. |
Has been a technical analyst since 1969, and has worked as a futures and options trader with First Financial Futures in Johannesburg, South Africa.
| Address: | 3256 West 24th Ave |
| Vancouver, BC | |
| Phone # for sales: | 6042634214 |
| E-mail address: | petroosp@gmail.com |
Click here for more information about our publications!
PRINT THIS ARTICLE

Request Information From Our Sponsors
- StockCharts.com, Inc.
- Candle Patterns
- Candlestick Charting Explained
- Intermarket Technical Analysis
- John Murphy on Chart Analysis
- John Murphy's Chart Pattern Recognition
- John Murphy's Market Message
- MurphyExplainsMarketAnalysis-Intermarket Analysis
- MurphyExplainsMarketAnalysis-Visual Analysis
- StockCharts.com
- Technical Analysis of the Financial Markets
- The Visual Investor
- VectorVest, Inc.
- Executive Premier Workshop
- One-Day Options Course
- OptionsPro
- Retirement Income Workshop
- Sure-Fire Trading Systems (VectorVest, Inc.)
- Trading as a Business Workshop
- VectorVest 7 EOD
- VectorVest 7 RealTime/IntraDay
- VectorVest AutoTester
- VectorVest Educational Services
- VectorVest OnLine
- VectorVest Options Analyzer
- VectorVest ProGraphics v6.0
- VectorVest ProTrader 7
- VectorVest RealTime Derby Tool
- VectorVest Simulator
- VectorVest Variator
- VectorVest Watchdog
