HOT TOPICS LIST
- MACD
- Fibonacci
- RSI
- Gann
- ADXR
- Stochastics
- Volume
- Triangles
- Futures
- Cycles
- Volatility
- ZIGZAG
- MESA
- Retracement
- Aroon
INDICATORS LIST
LIST OF TOPICS
PRINT THIS ARTICLE
by Koos van der Merwe
Crude oil prices took a beating recently.
Position: Sell
Koos van der Merwe
Has been a technical analyst since 1969, and has worked as a futures and options trader with First Financial Futures in Johannesburg, South Africa.
PRINT THIS ARTICLE
TECHNICAL ANALYSIS
BP PLC
05/17/17 04:53:26 PMby Koos van der Merwe
Crude oil prices took a beating recently.
Position: Sell
| On Friday, May 5th, West Texas Intermediate crude oil trading on the New York Mercantile Exchange logged a weekly decline of 6%. Prices marked the lowest settlement since November 29th, the day before the Organization of the Petroleum Exporting Countries announced an agreement to limit production by 1.2 million barrels a day. However, it is U.S. shale-oil producers that are being credited with the recent downturn in oil prices. With oil price falling, it stands to reason that gas (petrol) prices should also fall, and yet British Petroleum looks interesting. British Petroleum, today known as BP PLC, is a British multinational oil and gas company headquartered in London, England. The company is a vertically integrated company operating in all areas of the oil and gas industry, with energy interests in wind power. As of 31st December 2015, the company had operations in more than 70 countries. |

|
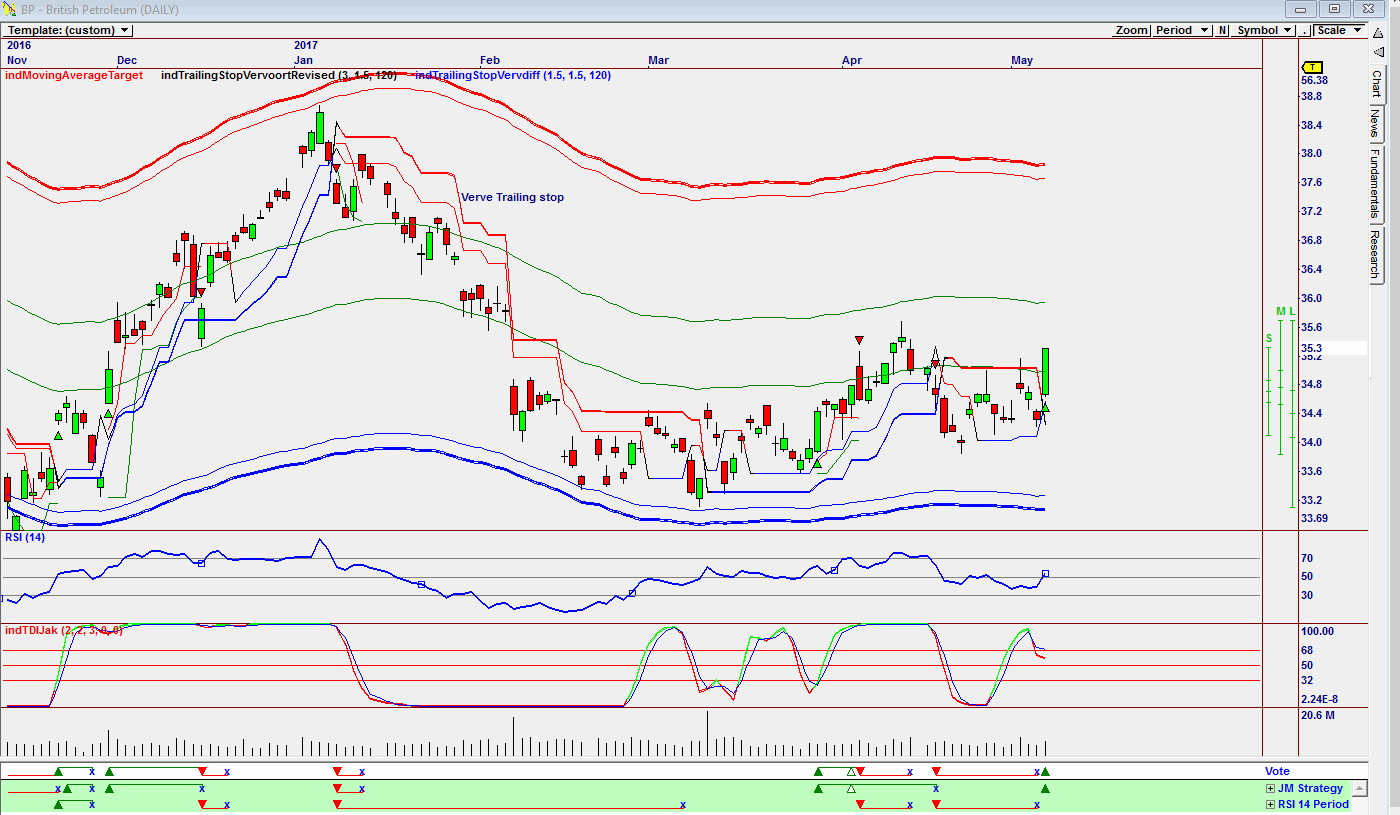
| Figure 1. Omnitrader chart suggesting a buy. |
| Graphic provided by: Omnitrader.. |
| |
| The chart in Figure 1 is a daily Omnitrader chart with the Vote line suggesting a buy based on the JM Strategy. Do note the share price which rose strongly on Friday, May 5th breaking above the Verve Trailing stop. Also note the two indicators, the RSI 14 and the TDIJak. Neither have suggested a buy although the RSI indicator is starting to turn up. |

|
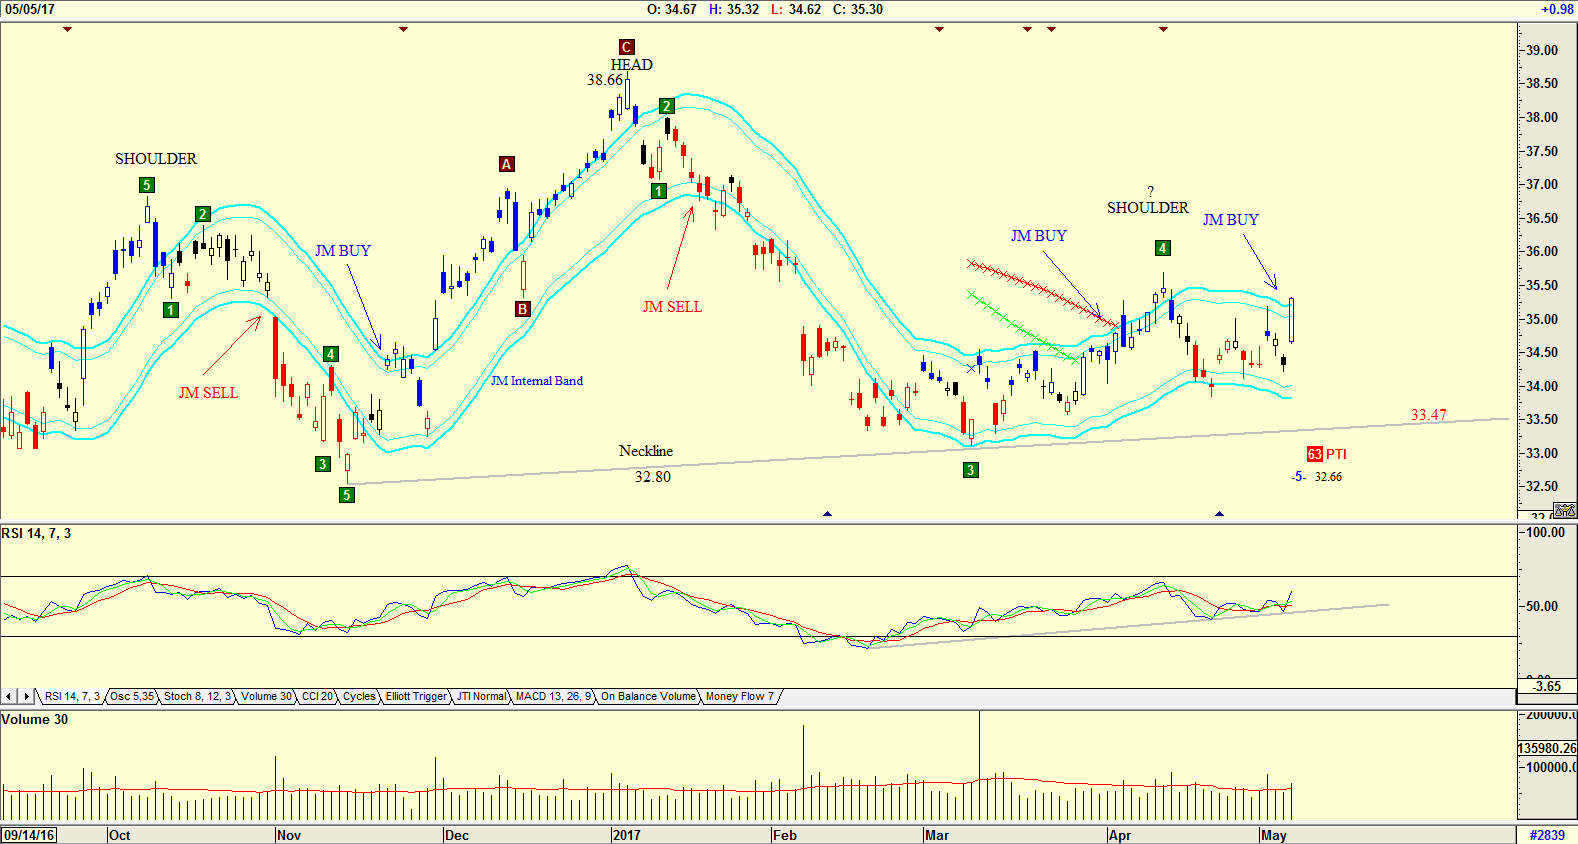
| Figure 2. Chart suggesting caution ahead. |
| Graphic provided by: AdvancedGET. |
| |
| Analyzing the share price using the Advanced GET program, we see that the Elliott Wave count suggested is calling for a drop in price in a WAVE 5 to $32.66. The PTI (probability Index) is 63 which is a high percentage. Do note that the share price has moved above the upper JM Internal Band suggesting a buy. The JM Internal Band is a 15-period simple moving average offset by 2% positive and 2% negative. A move above the upper band suggests a buy and below the lower band a sell. Note also the RSI indicator which is trending upwards. Volume as the price rose is above average. The chart pattern is also suggesting a Head and Shoulder formation, and should the price fall below the neckline at $32.80, the target will be $26.94. (38.66-32.80 = 5.86. 32.80-5.86=26.94). With the Oil Price uncertainty throughout the world, a fact that influences any company that has an oil price attachment, caution in trading the share is very necessary. |
Has been a technical analyst since 1969, and has worked as a futures and options trader with First Financial Futures in Johannesburg, South Africa.
| Address: | 3256 West 24th Ave |
| Vancouver, BC | |
| Phone # for sales: | 6042634214 |
| E-mail address: | petroosp@gmail.com |
Click here for more information about our publications!
PRINT THIS ARTICLE

Request Information From Our Sponsors
- StockCharts.com, Inc.
- Candle Patterns
- Candlestick Charting Explained
- Intermarket Technical Analysis
- John Murphy on Chart Analysis
- John Murphy's Chart Pattern Recognition
- John Murphy's Market Message
- MurphyExplainsMarketAnalysis-Intermarket Analysis
- MurphyExplainsMarketAnalysis-Visual Analysis
- StockCharts.com
- Technical Analysis of the Financial Markets
- The Visual Investor
- VectorVest, Inc.
- Executive Premier Workshop
- One-Day Options Course
- OptionsPro
- Retirement Income Workshop
- Sure-Fire Trading Systems (VectorVest, Inc.)
- Trading as a Business Workshop
- VectorVest 7 EOD
- VectorVest 7 RealTime/IntraDay
- VectorVest AutoTester
- VectorVest Educational Services
- VectorVest OnLine
- VectorVest Options Analyzer
- VectorVest ProGraphics v6.0
- VectorVest ProTrader 7
- VectorVest RealTime Derby Tool
- VectorVest Simulator
- VectorVest Variator
- VectorVest Watchdog
