HOT TOPICS LIST
- MACD
- Fibonacci
- RSI
- Gann
- ADXR
- Stochastics
- Volume
- Triangles
- Futures
- Cycles
- Volatility
- ZIGZAG
- MESA
- Retracement
- Aroon
INDICATORS LIST
LIST OF TOPICS
PRINT THIS ARTICLE
by David Penn
Broken trendlines and failed new high attempts suggest that the Dow Utilities, Industrials and Transports remain under pressure.
Position: N/A
David Penn
Technical Writer for Technical Analysis of STOCKS & COMMODITIES magazine, Working-Money.com, and Traders.com Advantage.
PRINT THIS ARTICLE
REVERSAL
Dow Reversal?
12/05/02 12:15:01 PMby David Penn
Broken trendlines and failed new high attempts suggest that the Dow Utilities, Industrials and Transports remain under pressure.
Position: N/A
| Trendlines, support and resistance, new highs and new lows ... throw in a few candlestick patterns and there might be little more that the average trader needs in order to make sense (or at least sound risk/reward judgements) about the markets. This look at the three main Dow Jones Averages--Utilities, Industrials and Transports--will rely on these basic tools to advance the case that each shows signs that the rallies that began in mid-October are increasingly overextended and ripe for correction. |
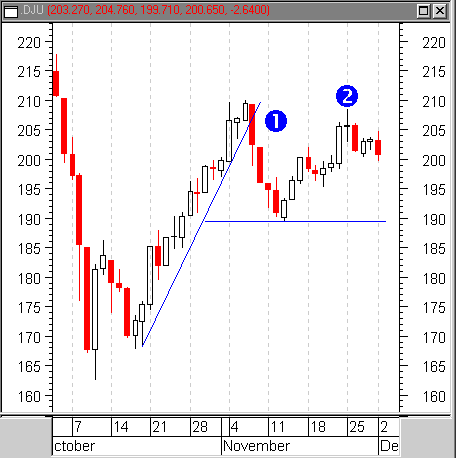
| Consider first the Dow Jones Utilities Average. Utilities stocks have been falling for quite some time, but they were not left out when the stock markets put in a bottom in mid-October (actually, closer to October 10th). From the intraday low on October 10th to the intraday high on November 6th, the DJUA climbed over 47 points for a gain of 29%. Note however that the DJUA broke its up trendline with a correction in early November. This break was severe, but not necessarily fatal to the DJUA's uptrend. No new low was made in the correction, thus in spite of the trend line break to the downside, it could still be argued that the DJUA was in an uptrend--if at a lower angle of ascent. |

|
| Figure 1: A trendline break (1) and a doji-like price bar (2) at the top of the post-break rally are bearish for the DJUA. |
| Graphic provided by: MetaStock. |
| |
| An ominous sign, however, developed with the rally that followed the early November correction. This sign consisted of a rally that appears to have peaked with a typically indecisive "doji"-like price bar, as no new high was established. A "doji" candlestick is one in which the open and the close are at virtually the same level, with significant intraday trading both above and below the open/close level. Dojis--particularly after rallies or declines--suggest that the upside or downside momentum has faded, and that the market is increasingly vulnerable to correction or reversal. It should also be noted that the failure of the post-break rally to establish a new high above 210 is further evidence that the DJUA's rally may be over for the time being. The end of the rally is one thing, but conclusive evidence of an actual trend reversal would most likely require a decline beneath support at 190, which represents the most recent correction low. A drop to this area would establish a significant, intermediate-term low, and most likely indicate that the trend had in fact reversed. |
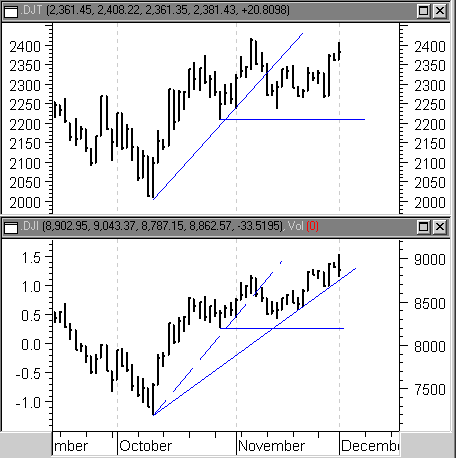
| Is the bearishness of the DJUA shared by the Industrials and Transports? Looking at the combined charts of the DJI and DJT, immediately obvious is that, while the Industrials have made a new high, the Transports have not. This is a warning signal from a Dow Theory perspective, a perspective that (among other things) posits that "the averages must confirm." When one average makes a new high and that new high is not followed by a new high in the other average, Dow Theory suggests that a correction may be in store for the average that made the new high--a new high that could easily turn into a bull trap. |
 Figure 2: A Dow Theory non-confirmation appears. New highs for the Industrials, but the Transports--so far--have not followed through on the upside. This difference is also underscored by the way the respective up trendlines are cast. I draw up trendlines by tracing a line from the most significant intermediate low to the highest low immediately before the highest high (reverse for down trend lines). This approach not only helps keep trend lines consistent from chart to chart, but it also helps keep track of where the significant highs and lows are in relation to the trend. Here, we see that the Transports have broken their trendline on the downside, and are in the process of trying to regain upside momentum, possibly establishing a new high and resuming the trend upward. Below, in the Industrials, the trendline has already been moved out and over (solid line) from its previous location (dotted line). Why was the trendline moved? Because although the Dow Industrials broke down through the earlier trendline (dotted), they did not establish a lower low (the previous correction low of 8,200 held firm). When prices tried to regain higher ground, they were able to do so in late November, finally establishing a new high at the end of the month. Thus, while the Dow Utilities and Transports look increasingly bearish, the Dow Industrials have managed to hold up. While it is possible that both the Utilities and Transports will find sufficient buying strength to propel their respective averages to new highs, the focus must now be on the Dow Industrials. Any break in the newer up trend line for the Industrials must be regarded with caution--especially if any post-break rally fails to establish a new high north of the 9,065 territory the DJIA has already staked out. |
Technical Writer for Technical Analysis of STOCKS & COMMODITIES magazine, Working-Money.com, and Traders.com Advantage.
| Title: | Technical Writer |
| Company: | Technical Analysis, Inc. |
| Address: | 4757 California Avenue SW |
| Seattle, WA 98116 | |
| Phone # for sales: | 206 938 0570 |
| Fax: | 206 938 1307 |
| Website: | www.Traders.com |
| E-mail address: | DPenn@traders.com |
Traders' Resource Links | |
| Charting the Stock Market: The Wyckoff Method -- Books | |
| Working-Money.com -- Online Trading Services | |
| Traders.com Advantage -- Online Trading Services | |
| Technical Analysis of Stocks & Commodities -- Publications and Newsletters | |
| Working Money, at Working-Money.com -- Publications and Newsletters | |
| Traders.com Advantage -- Publications and Newsletters | |
| Professional Traders Starter Kit -- Software | |
Click here for more information about our publications!
Comments
Date: 12/05/02Rank: 4Comment:
Date: 12/06/02Rank: 5Comment:

|

Request Information From Our Sponsors
- StockCharts.com, Inc.
- Candle Patterns
- Candlestick Charting Explained
- Intermarket Technical Analysis
- John Murphy on Chart Analysis
- John Murphy's Chart Pattern Recognition
- John Murphy's Market Message
- MurphyExplainsMarketAnalysis-Intermarket Analysis
- MurphyExplainsMarketAnalysis-Visual Analysis
- StockCharts.com
- Technical Analysis of the Financial Markets
- The Visual Investor
- VectorVest, Inc.
- Executive Premier Workshop
- One-Day Options Course
- OptionsPro
- Retirement Income Workshop
- Sure-Fire Trading Systems (VectorVest, Inc.)
- Trading as a Business Workshop
- VectorVest 7 EOD
- VectorVest 7 RealTime/IntraDay
- VectorVest AutoTester
- VectorVest Educational Services
- VectorVest OnLine
- VectorVest Options Analyzer
- VectorVest ProGraphics v6.0
- VectorVest ProTrader 7
- VectorVest RealTime Derby Tool
- VectorVest Simulator
- VectorVest Variator
- VectorVest Watchdog
