HOT TOPICS LIST
- MACD
- Fibonacci
- RSI
- Gann
- ADXR
- Stochastics
- Volume
- Triangles
- Futures
- Cycles
- Volatility
- ZIGZAG
- MESA
- Retracement
- Aroon
INDICATORS LIST
LIST OF TOPICS
PRINT THIS ARTICLE
by Koos van der Merwe
With so many advisors calling for a major correction in the US stock market, a look at Canadian stocks is a possibly the way to go.
Position: Accumulate
Koos van der Merwe
Has been a technical analyst since 1969, and has worked as a futures and options trader with First Financial Futures in Johannesburg, South Africa.
PRINT THIS ARTICLE
TECHNICAL ANALYSIS
A Canadian Share To Watch
05/10/17 03:25:20 PMby Koos van der Merwe
With so many advisors calling for a major correction in the US stock market, a look at Canadian stocks is a possibly the way to go.
Position: Accumulate
| The Premier of Alberta, Canada, Rachel Notley, has warned President Donald Trump that should he start employing energy trade restrictions with Canada, he would face the wrath of Canada's many allies. She is disturbed by Trump's remarks about what Canada has done to its American neighbor with the energy, softwood lumber and dairy industries. Trump has stated that he intends to revise, if not cancel, the North American Free Trade Agreement (NAFTA), which strings together Mexico, Canada and the U.S. through a uniform tariff policy. The U.S. is the largest refining complex in the world, and Canada's cheap heavy oil pricing relative to other competing crude grades in the West and Gulf Coast has given considerable profits to U.S. heavy oil refiners. As a businessman first and a politician second, this fact may influence President Trump's decision. With the US$ presently very strong against the C$, looking at Canadian oil shares may be the way to go. |

|
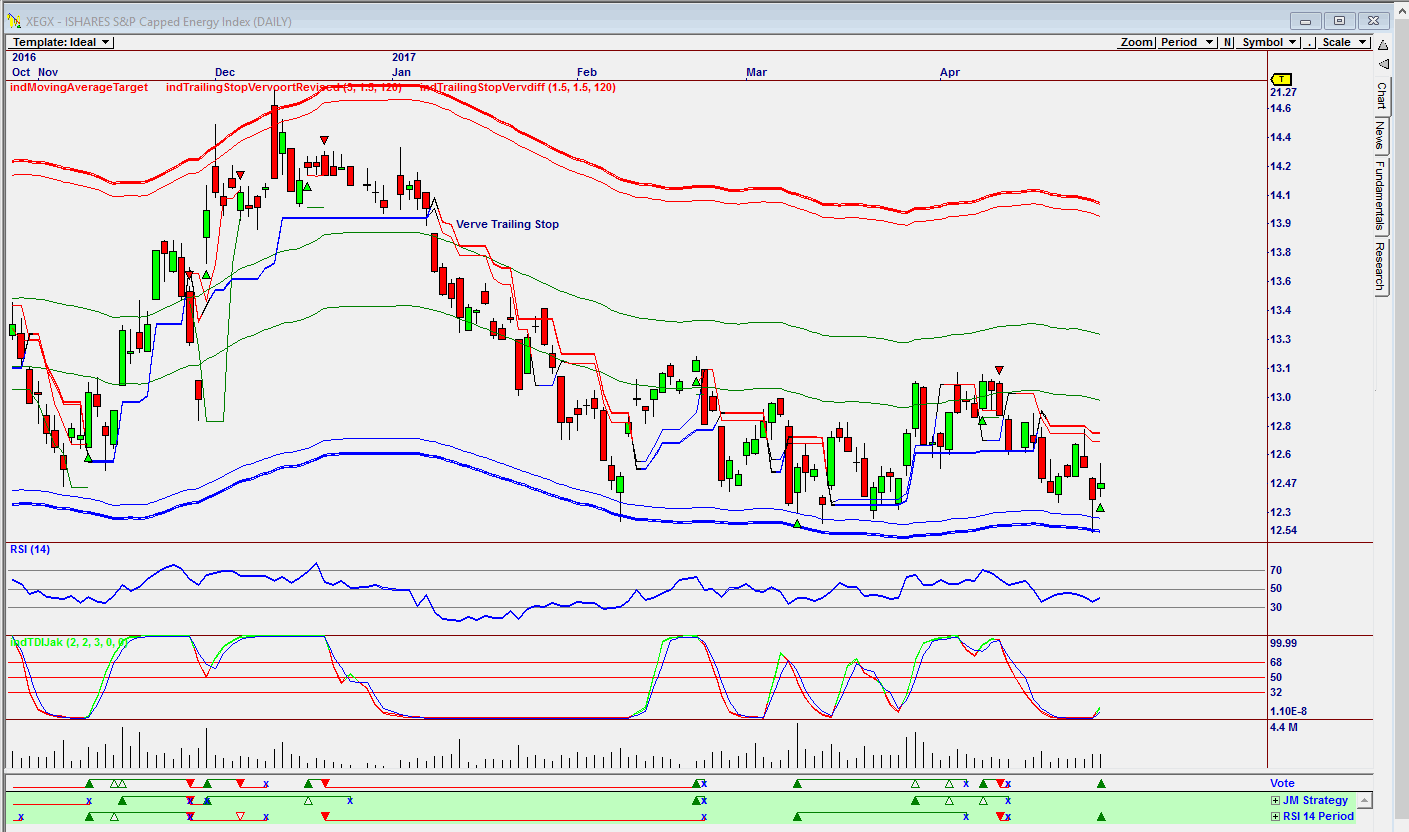
| Figure 1. Daily Omnitrader chart showing a buy. |
| Graphic provided by: Omnitrader. |
| |
| The chart in Figure 1 is an Omnitrader chart of the iShare S&P Capped Energy Index listed on the Canadian Stock Exchange under the symbol XEG-T. The chart shows that a buy signal has been given on the Vote line at C$12.47 based on the RSI-14 Period strategy shown below the Vote line. Do note the two indicators which are at oversold levels and are suggesting a buy. Volume is still low but does show slight increase recently. |

|
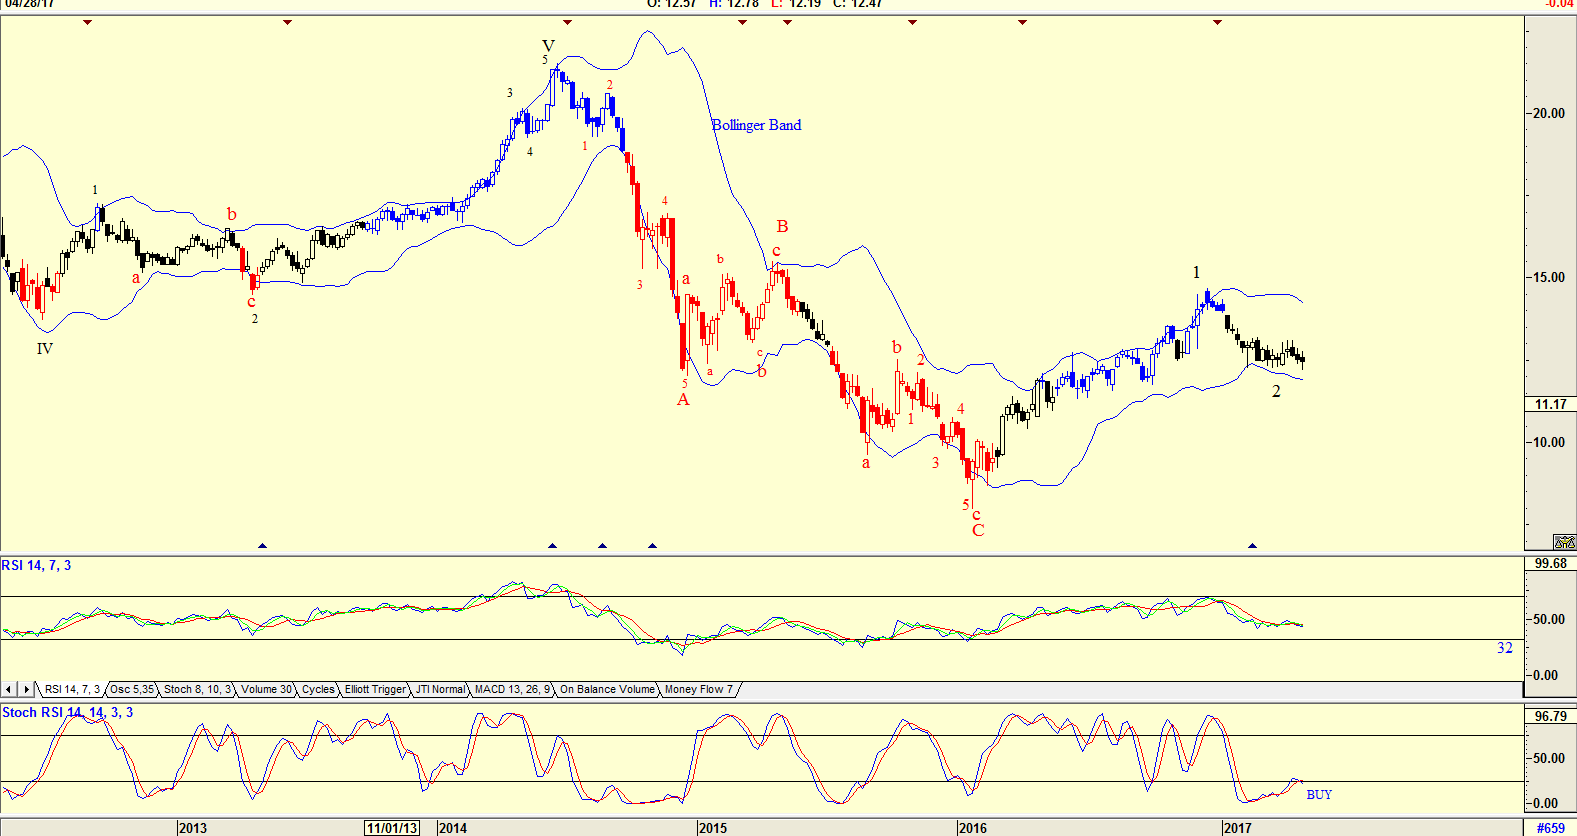
| Figure 2. Weekly Advanced GET chart with an Elliott wave count. |
| Graphic provided by: AdvancedGET. |
| |
| The chart in Figure 2 is a weekly chart on the Advanced GET program. The chart has an Elliott count suggesting that the iShare could be moving into a new bull trend. With the Stochastic RSI indicator suggesting a buy and the iShare testing the lower Bollinger Band this is very much a possibility. The RSI-14 indicator however has not fallen below the 32 horizontal line and given a buy, suggesting that the share price could trend sideways if not move lower before moving up. The share, iShare S&P Capped Energy Index, is a share on my watch list. I may start nibbling at the share at present levels based purely on the fact the President Trump has shown that he quickly changes his mind over policies, and as a businessman, he may be swayed by considerable profit. |
Has been a technical analyst since 1969, and has worked as a futures and options trader with First Financial Futures in Johannesburg, South Africa.
| Address: | 3256 West 24th Ave |
| Vancouver, BC | |
| Phone # for sales: | 6042634214 |
| E-mail address: | petroosp@gmail.com |
Click here for more information about our publications!
PRINT THIS ARTICLE

Request Information From Our Sponsors
- StockCharts.com, Inc.
- Candle Patterns
- Candlestick Charting Explained
- Intermarket Technical Analysis
- John Murphy on Chart Analysis
- John Murphy's Chart Pattern Recognition
- John Murphy's Market Message
- MurphyExplainsMarketAnalysis-Intermarket Analysis
- MurphyExplainsMarketAnalysis-Visual Analysis
- StockCharts.com
- Technical Analysis of the Financial Markets
- The Visual Investor
- VectorVest, Inc.
- Executive Premier Workshop
- One-Day Options Course
- OptionsPro
- Retirement Income Workshop
- Sure-Fire Trading Systems (VectorVest, Inc.)
- Trading as a Business Workshop
- VectorVest 7 EOD
- VectorVest 7 RealTime/IntraDay
- VectorVest AutoTester
- VectorVest Educational Services
- VectorVest OnLine
- VectorVest Options Analyzer
- VectorVest ProGraphics v6.0
- VectorVest ProTrader 7
- VectorVest RealTime Derby Tool
- VectorVest Simulator
- VectorVest Variator
- VectorVest Watchdog
