HOT TOPICS LIST
- MACD
- Fibonacci
- RSI
- Gann
- ADXR
- Stochastics
- Volume
- Triangles
- Futures
- Cycles
- Volatility
- ZIGZAG
- MESA
- Retracement
- Aroon
INDICATORS LIST
LIST OF TOPICS
PRINT THIS ARTICLE
by Koos van der Merwe
With the increase in terrorism throughout the world and political uncertainty on the increase, where is the best place to invest your money?
Position: Accumulate
Koos van der Merwe
Has been a technical analyst since 1969, and has worked as a futures and options trader with First Financial Futures in Johannesburg, South Africa.
PRINT THIS ARTICLE
TECHNICAL ANALYSIS
Dream Office REIT
05/01/17 12:30:44 PMby Koos van der Merwe
With the increase in terrorism throughout the world and political uncertainty on the increase, where is the best place to invest your money?
Position: Accumulate
| On Sunday, April 23rd, France is going to the polls. The British Prime Minister, Theresa May, has called for a snap election on June 8th, a vote she says will strengthen her hand in divorce talks with the European Union and help heal divisions in Britain. With Turkey's vote effectively making its President Erdogen a dictator and with the American President, Donald Trump, showing the world that he can change his mind about policies in the blink of an eye, and finally, with an increase in terrorism throughout Europe and the Middle East, where do you invest your money? The decision is not an easy one. Gold, the investors first choice, has been falling recently. REITS have also not been that attractive. With President Trump calling the US$ too strong, moving money out of America seems the obvious choice, and even though Donald Trump has called Justin Trudeau "Canada's Worst President yet", Canada looks like the place to go. One share that is capturing attention is Dream Office REIT listed on the Canadian stock exchange. Dream Office Real Estate Investment Trust is one of the largest investment trusts in Canada. The company owns office buildings across Canada. The company pays a monthly distribution to its Unit-holders, of which only a portion is taxable. |

|
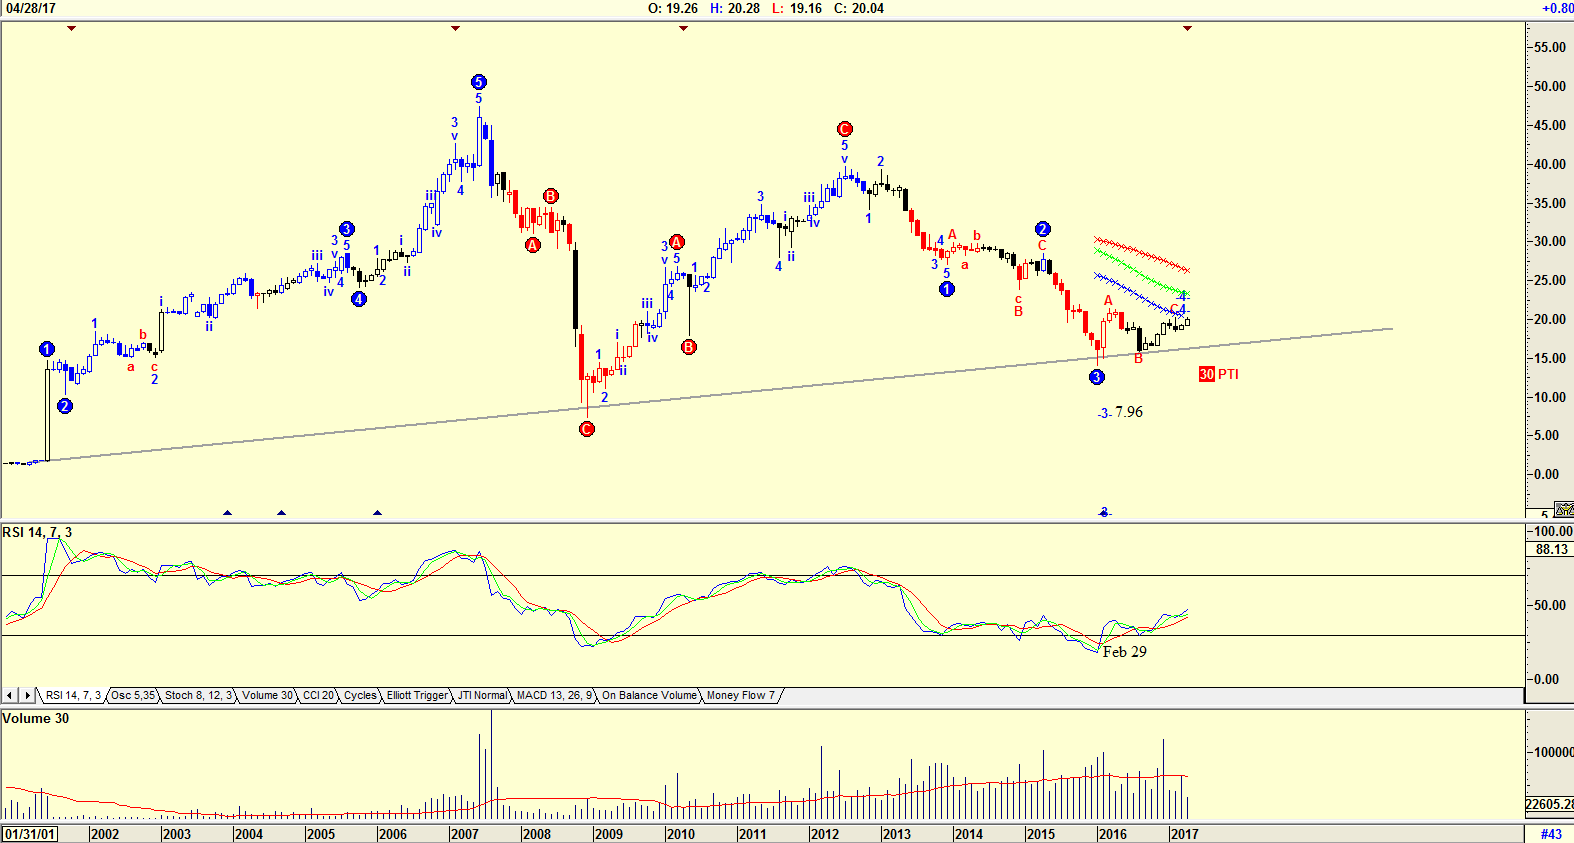
| Figure 1. Monthly chart. |
| Graphic provided by: AdvancedGET. |
| |
| The chart in Figure 1 is a monthly chart showing an Elliott wave count suggesting that the share price could drop further to the $7.96 level. However, with the PTI (probability Index) at 30, the probability of this occurring is unlikely. When the PTI is less than 32, then one should know that the Elliott wave count suggested by the Advanced GET program is unlikely. The RSI indicator gave a buy on February 29th and the share price has risen. Previous buy and sell RSI signals as shown on the chart have been remarkably accurate. However, as the share recently rose, volume has fallen — a negative sign. |

|
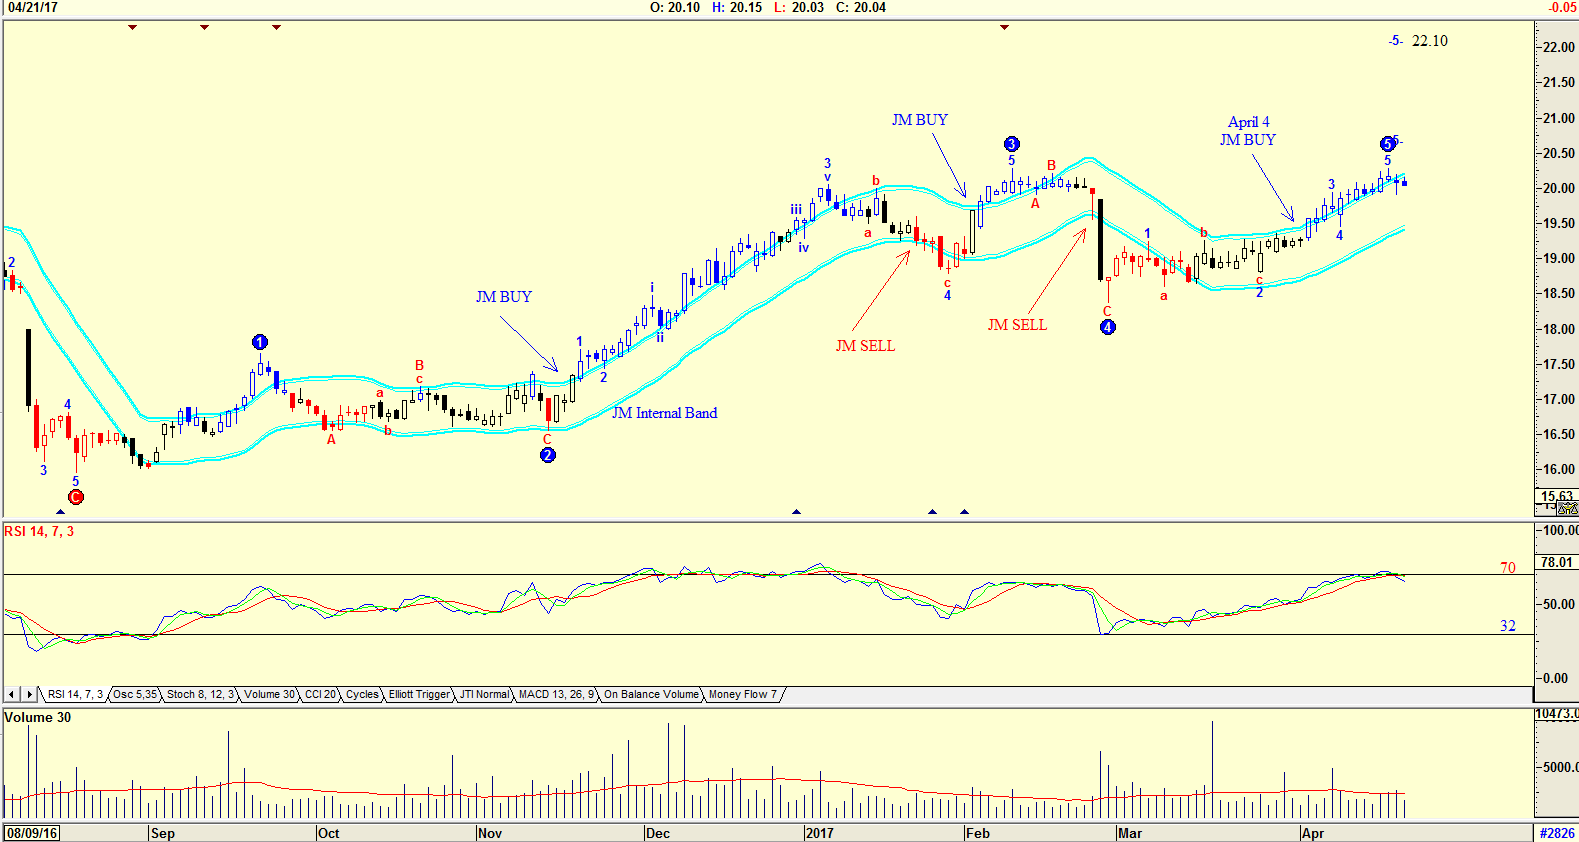
| Figure 2. Daily chart with JM Internal Band. |
| Graphic provided by: AdvancedGET. |
| |
| The daily chart in Figure 2 is a chart with an Elliott wave count suggesting that the price is in a WAVE 5 and could move to $22.10. The RSI indicator is overbought and has given a sell signal, and with volume below average, this sell signal could be true. With the share price at $20.04 offering a 7.49% pa yield, buying the share at a lower price and holding for the long term is very much a plus offering a greater yield. Of course, a capital gain is also a plus, so buying the share at a lower price is very much the way to go. One could therefore wait for the RSI indicator to move below the 32 horizontal, then move up to suggest a buy. |
| Conservative investors could wait for the JM Internal Band to suggest a buy. The JM Internal Band is a 15 period simple moving average offset by 2% positive and 2% negative. A move above the upper band suggests a buy, and below the lower band a sell. With uncertainty increasing in the American Stock Market, looking for a safe interest-bearing stock is becoming the way to go. Looking to Canada with its interest-bearing stocks is very tempting. |
Has been a technical analyst since 1969, and has worked as a futures and options trader with First Financial Futures in Johannesburg, South Africa.
| Address: | 3256 West 24th Ave |
| Vancouver, BC | |
| Phone # for sales: | 6042634214 |
| E-mail address: | petroosp@gmail.com |
Click here for more information about our publications!
PRINT THIS ARTICLE

Request Information From Our Sponsors
- VectorVest, Inc.
- Executive Premier Workshop
- One-Day Options Course
- OptionsPro
- Retirement Income Workshop
- Sure-Fire Trading Systems (VectorVest, Inc.)
- Trading as a Business Workshop
- VectorVest 7 EOD
- VectorVest 7 RealTime/IntraDay
- VectorVest AutoTester
- VectorVest Educational Services
- VectorVest OnLine
- VectorVest Options Analyzer
- VectorVest ProGraphics v6.0
- VectorVest ProTrader 7
- VectorVest RealTime Derby Tool
- VectorVest Simulator
- VectorVest Variator
- VectorVest Watchdog
- StockCharts.com, Inc.
- Candle Patterns
- Candlestick Charting Explained
- Intermarket Technical Analysis
- John Murphy on Chart Analysis
- John Murphy's Chart Pattern Recognition
- John Murphy's Market Message
- MurphyExplainsMarketAnalysis-Intermarket Analysis
- MurphyExplainsMarketAnalysis-Visual Analysis
- StockCharts.com
- Technical Analysis of the Financial Markets
- The Visual Investor
