

HOT TOPICS LIST
- MACD
- Fibonacci
- RSI
- Gann
- ADXR
- Stochastics
- Volume
- Triangles
- Futures
- Cycles
- Volatility
- ZIGZAG
- MESA
- Retracement
- Aroon
INDICATORS LIST
LIST OF TOPICS
PRINT THIS ARTICLE
by Koos van der Merwe
Two companies that have performed extremely well are Apple and Facebook. What does the future trend look like for them?
Position: Hold
Koos van der Merwe
Has been a technical analyst since 1969, and has worked as a futures and options trader with First Financial Futures in Johannesburg, South Africa.
PRINT THIS ARTICLE
TECHNICAL ANALYSIS
A Look At Apple And Facebook
04/05/17 04:14:19 PMby Koos van der Merwe
Two companies that have performed extremely well are Apple and Facebook. What does the future trend look like for them?
Position: Hold
| When one looks back at the history of these two companies, one kicks oneself saying, "Why didn't I buy thousands of shares of each back then?" Both Apple and Facebook have performed extremely well over the years. In 2001 the Apple share price hit a low of $1.05, and when Facebook listed in May 2012, its share price dropped to a low of $18.26. Looking at the charts today, one asks, where are the shares going to? How much higher can they go? |
|
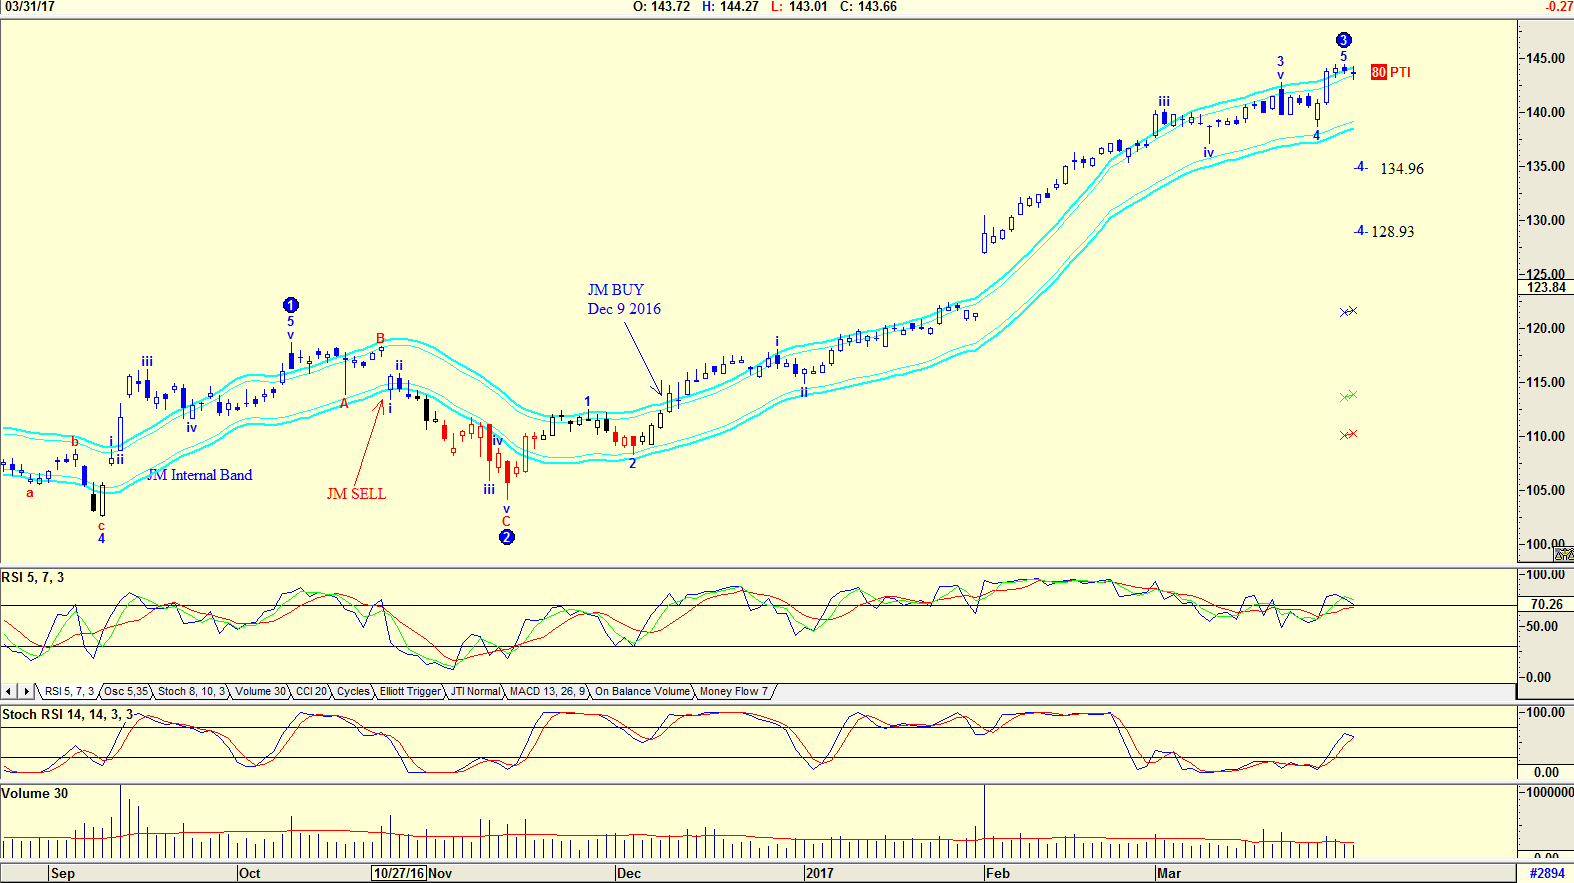
| Figure 1. Daily chart of Apple with Elliott wave count. |
| Graphic provided by: AdvancedGET. |
| |
| The chart in Figure 1 is a daily chart of Apple Computers with an Elliott wave count suggesting that the share price should now correct in a WAVE 4, bottoming at either $134.96 or $128.93. The PTI (Probability Index) is 80, which suggests that the probability of this correction occurring is 80%. The RSI14 index is at overbought levels suggesting weakness, as is the Stochastic index. Volume is presently below average. Do note the JM Internal Band which gave a buy on December 9th, 2016. The JM Internal Band is a 15-period simple moving average offset by 2% positive and 2% negative. A move above the upper band is a buy and below the lower band, a sell. |
|
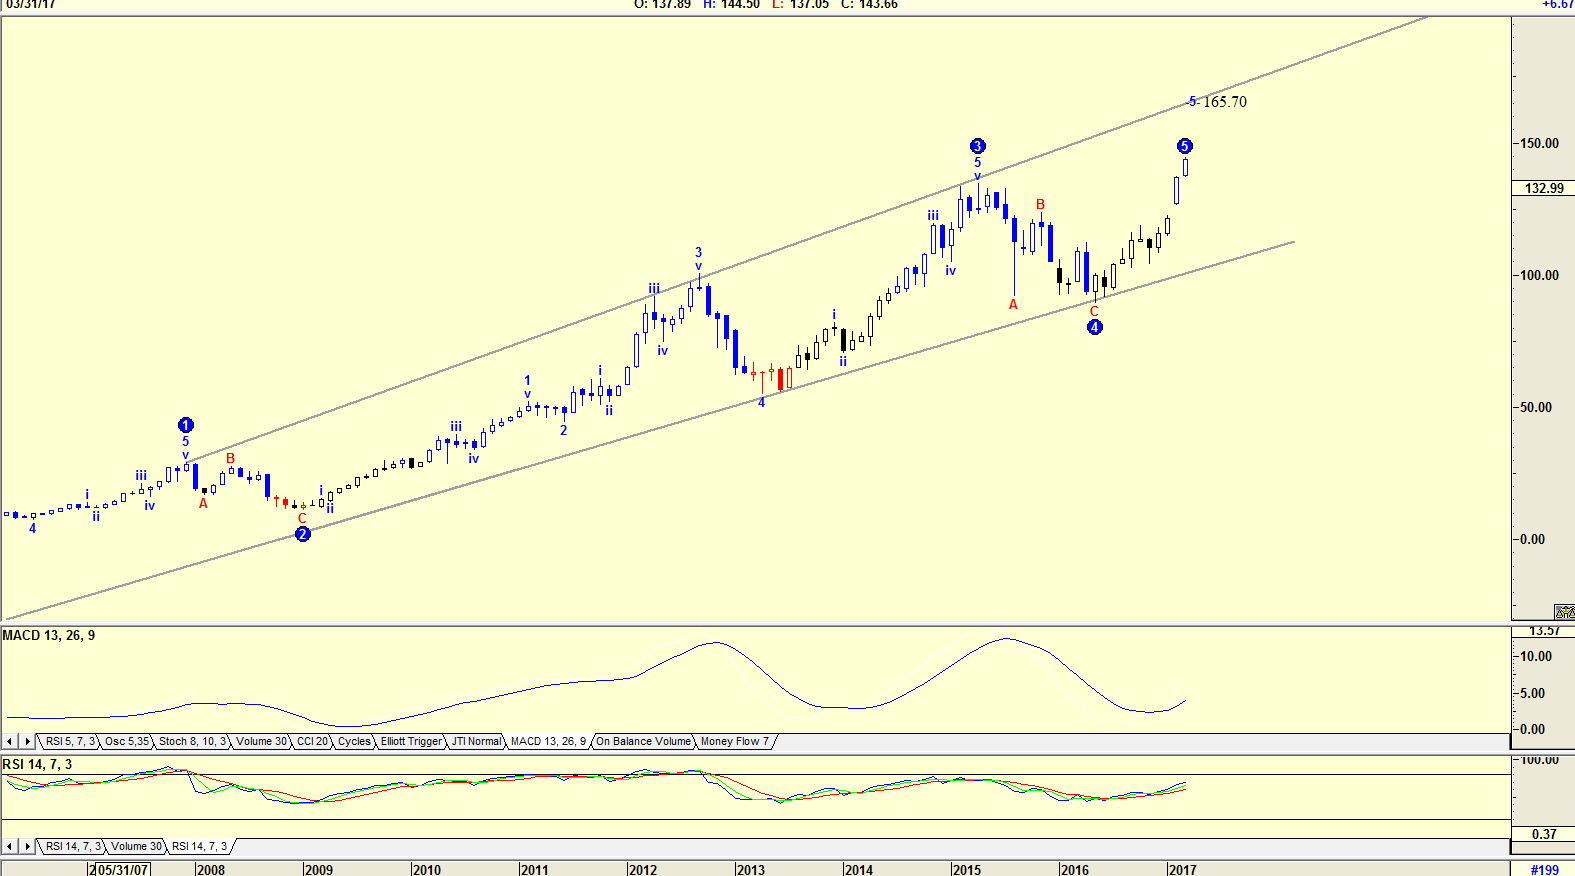
| Figure 2. Weekly chart of Apple. |
| Graphic provided by: AdvancedGET. |
| |
| The chart in Figure 2 is a monthly chart with an Elliott wave count suggesting that the share price could rise in a WAVE 5 to $165.70. The MACD indicator suggests that this could well happen. The RSI indicator which is trending up is confirming this. |
|
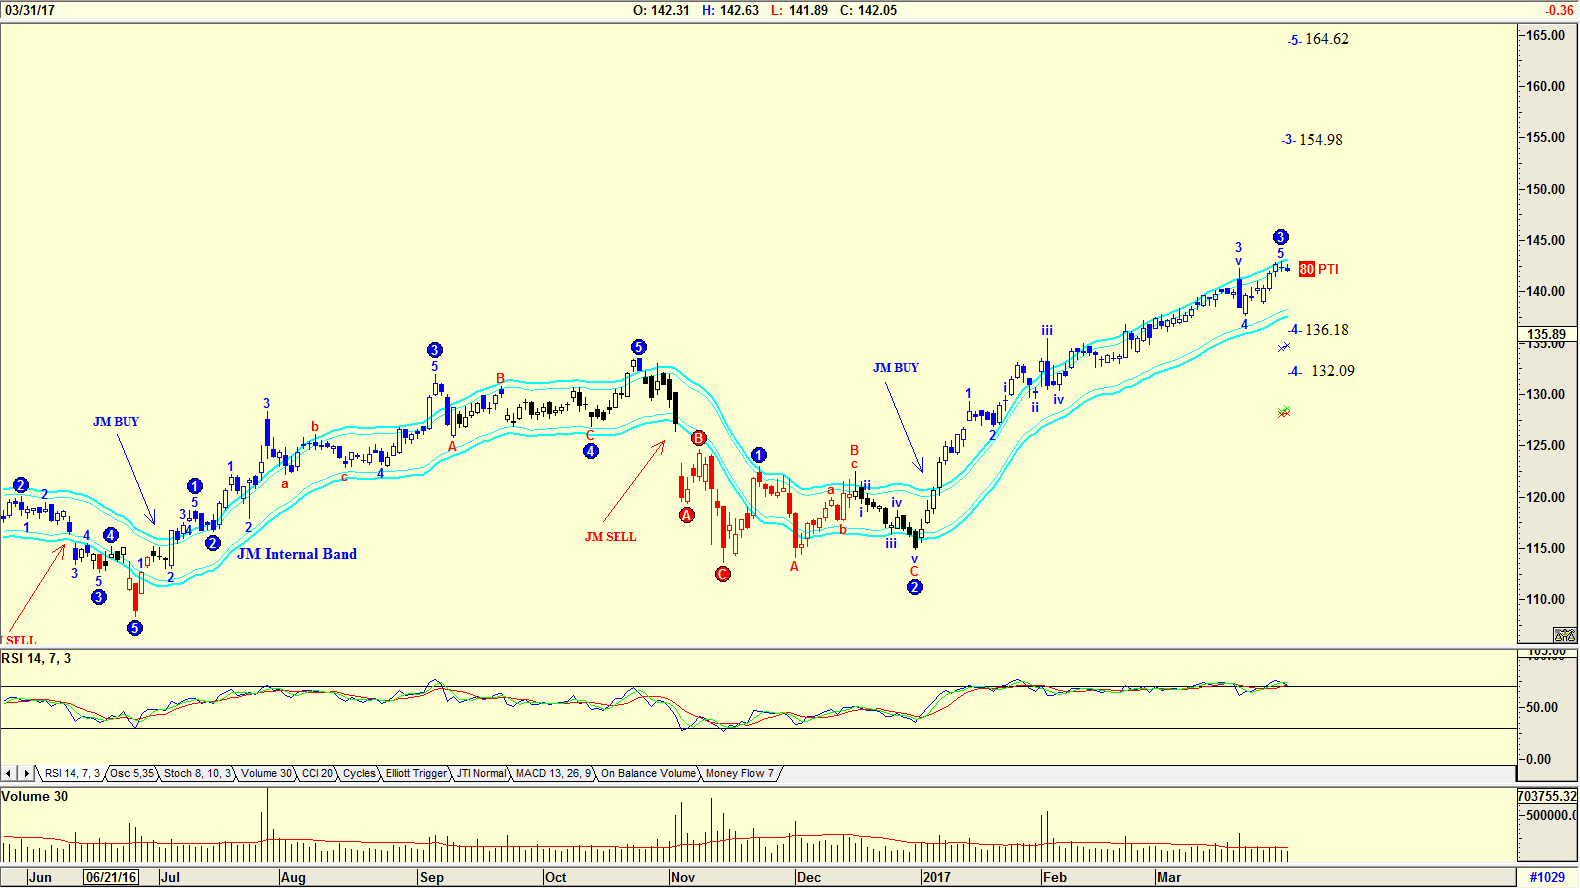
| Figure 3. Daily chart of Facebook with Elliott wave count. |
| Graphic provided by: AdvancedGET. |
| |
| Figure 3 is a daily Elliott wave chart of Facebook. Once again the chart is suggesting that the share price may have completed a WAVE 3 and should now fall in a WAVE 4 to either $136.18 or $132.09. However, although the chart is suggesting a PTI of 80, it is also suggesting that the share price could rise to complete WAVE 3 at $154.98, and rise after a WAVE 4 correction to a high of $164.62. Do note the JM Internal Band, the fact that the RSI indicator is at overbought levels, and that volume is below average. |
|
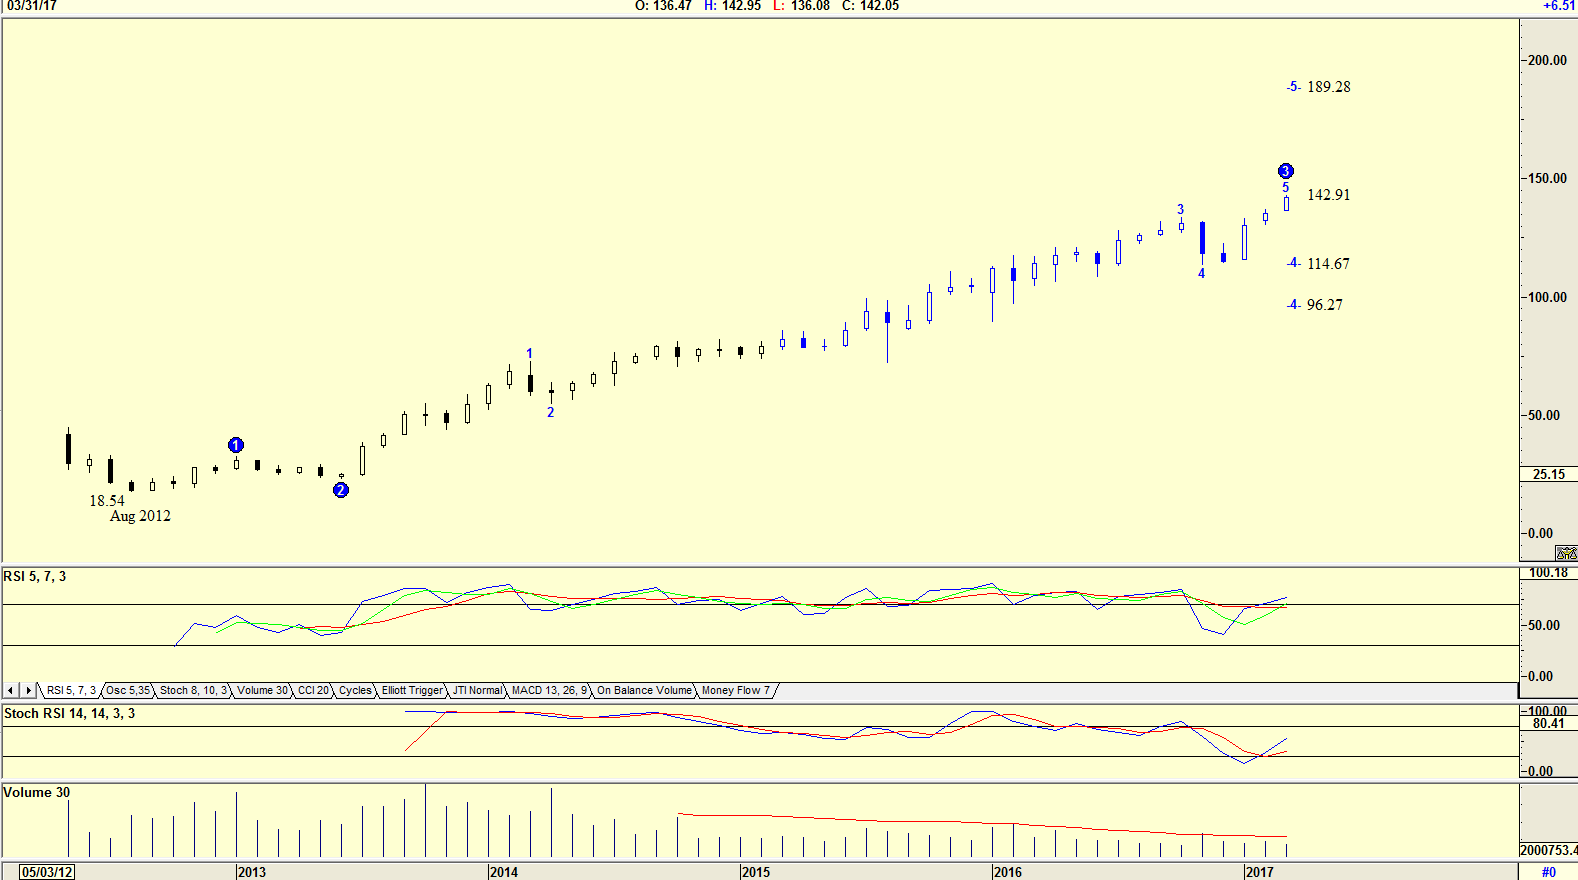
| Figure 4. Monthly chart of Facebook |
| Graphic provided by: AdvancedGET. |
| |
| Figure 4 is a monthly chart of Facebook with an Elliott wave count suggesting that the share price could fall to $114.67 or $96.27. The chart is also suggesting that once WAVE 4 is complete, the share price could rise to $189.28 in a WAVE 5. Do note the Stochastic RSI is still in an uptrend, suggesting that the price could rise higher. The RSI 5 indicator, however, is at overbought levels. Volume is also below average. Buying either Apple or Facebook shares at their present price is risky at the moment. However, both shares have performed exceptionally well, and they are shares that one should buy and hold as they correct. Both are companies that should become an integral part of one's portfolio. |
Has been a technical analyst since 1969, and has worked as a futures and options trader with First Financial Futures in Johannesburg, South Africa.
| Address: | 3256 West 24th Ave |
| Vancouver, BC | |
| Phone # for sales: | 6042634214 |
| E-mail address: | petroosp@gmail.com |
Click here for more information about our publications!
Comments
Date:�04/06/17Rank:�5Comment:�

Request Information From Our Sponsors
- StockCharts.com, Inc.
- Candle Patterns
- Candlestick Charting Explained
- Intermarket Technical Analysis
- John Murphy on Chart Analysis
- John Murphy's Chart Pattern Recognition
- John Murphy's Market Message
- MurphyExplainsMarketAnalysis-Intermarket Analysis
- MurphyExplainsMarketAnalysis-Visual Analysis
- StockCharts.com
- Technical Analysis of the Financial Markets
- The Visual Investor
- VectorVest, Inc.
- Executive Premier Workshop
- One-Day Options Course
- OptionsPro
- Retirement Income Workshop
- Sure-Fire Trading Systems (VectorVest, Inc.)
- Trading as a Business Workshop
- VectorVest 7 EOD
- VectorVest 7 RealTime/IntraDay
- VectorVest AutoTester
- VectorVest Educational Services
- VectorVest OnLine
- VectorVest Options Analyzer
- VectorVest ProGraphics v6.0
- VectorVest ProTrader 7
- VectorVest RealTime Derby Tool
- VectorVest Simulator
- VectorVest Variator
- VectorVest Watchdog