HOT TOPICS LIST
- MACD
- Fibonacci
- RSI
- Gann
- ADXR
- Stochastics
- Volume
- Triangles
- Futures
- Cycles
- Volatility
- ZIGZAG
- MESA
- Retracement
- Aroon
INDICATORS LIST
LIST OF TOPICS
PRINT THIS ARTICLE
by Gary Grosschadl
It looks like Goodyear Tire & Rubber has finally established a bottom via an intriguing looking pattern.
Position: N/A
Gary Grosschadl
Independent Canadian equities trader and technical analyst based in Peterborough
Ontario, Canada.
PRINT THIS ARTICLE
CHART ANALYSIS
Double Bottoms Plus a Cup & Handle
12/03/02 10:27:19 AMby Gary Grosschadl
It looks like Goodyear Tire & Rubber has finally established a bottom via an intriguing looking pattern.
Position: N/A
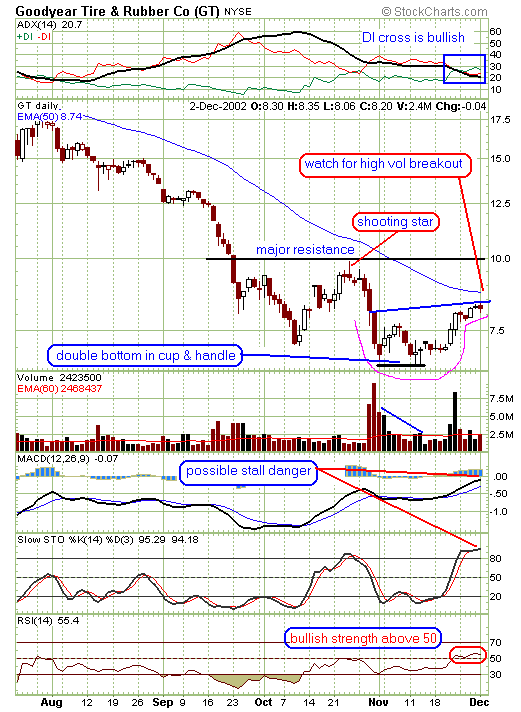
| Two things struck me when looking at this chart: a small double bottom and a suggestive cup & handle pattern. Although the double bottom is on the small side, the volume considerations are right on. A very large volume spike after four nasty down candles makes for a convincing looking bottom. This bottom was tested eight trading days later on much lower volume, correctly suggesting much diminished bearish power, and paving the way for an upside move. Candle readers should also note the tweezer bottom on the bottom restest. |
| Normally the cup and handle pattern is seen as a continuation pattern and not a bottom formation, however the volume considerations and shape are worthy of consideration. Purists would also point out that ideally the cup should form over a minimum of four weeks so I am cutting it some slack here - call it artistic license. What's more important is if this pattern follows through with an unmistakable pattern signal, that being a large volume breakout past the "handle" resistance. The 50-day EMA line hints of the larger volume move required to beat this likely moving average resistance. Looking ahead, should this high volume breakout occur, I would peg a likely trading target at or very near $10, based on a previous shooting star (as shown on the chart) and the "psychological" $10 level. |

|
| Graphic provided by: StockCharts.com. |
| |
| The displayed indicators are giving some mixed signals. On the positive side are the directional movement indicator ADX/DI and RSI. The ADX profile on the top of the chart shows that the bullish DI green line has finally managed to cross above bearish DI red line. This shows bullish potential especially if the back ADX line reverses and slopes upwards. The ideal setup is +DI over -DI with ADX inbetween and sloping upwards and this develpoment would coincide with bullish price action. The relative strength index (RSI) is a momentum oscillator that compares the magnitude of gains against the magnitude of losses. I find sustained movements above and below the 50 level often mark noteworthy action. |
| The potentially conflicting signals come from stochastics and MACD (moving average convergence/divergence). Stochastics are in overbought territory and once they turn down below 80, price action is starting to decline -- something to watch for. The MACD may hit a potential stall area at the zero line. A move past zero is bullish so the outcome here is worth noting. |
| In summary, this stock can do either of two things: an exposive high volume breakout towards $10 resistance (verifying the cup & handle pattern), or stall on failing stochastics and head back down looking for support likely in the $7-7.50 range. |
Independent Canadian equities trader and technical analyst based in Peterborough
Ontario, Canada.
| Website: | www.whatsonsale.ca/financial.html |
| E-mail address: | gwg7@sympatico.ca |
Click here for more information about our publications!
PRINT THIS ARTICLE

Request Information From Our Sponsors
- StockCharts.com, Inc.
- Candle Patterns
- Candlestick Charting Explained
- Intermarket Technical Analysis
- John Murphy on Chart Analysis
- John Murphy's Chart Pattern Recognition
- John Murphy's Market Message
- MurphyExplainsMarketAnalysis-Intermarket Analysis
- MurphyExplainsMarketAnalysis-Visual Analysis
- StockCharts.com
- Technical Analysis of the Financial Markets
- The Visual Investor
- VectorVest, Inc.
- Executive Premier Workshop
- One-Day Options Course
- OptionsPro
- Retirement Income Workshop
- Sure-Fire Trading Systems (VectorVest, Inc.)
- Trading as a Business Workshop
- VectorVest 7 EOD
- VectorVest 7 RealTime/IntraDay
- VectorVest AutoTester
- VectorVest Educational Services
- VectorVest OnLine
- VectorVest Options Analyzer
- VectorVest ProGraphics v6.0
- VectorVest ProTrader 7
- VectorVest RealTime Derby Tool
- VectorVest Simulator
- VectorVest Variator
- VectorVest Watchdog
