HOT TOPICS LIST
- MACD
- Fibonacci
- RSI
- Gann
- ADXR
- Stochastics
- Volume
- Triangles
- Futures
- Cycles
- Volatility
- ZIGZAG
- MESA
- Retracement
- Aroon
INDICATORS LIST
LIST OF TOPICS
PRINT THIS ARTICLE
by Koos van der Merwe
Everyone knows that Warren Buffett made his fortune buying and owning many businesses, as well as significant minority holdings in many companies. Can one use the movement of Berkshire Hathaway B shares as a trend guide?
Position: Accumulate
Koos van der Merwe
Has been a technical analyst since 1969, and has worked as a futures and options trader with First Financial Futures in Johannesburg, South Africa.
PRINT THIS ARTICLE
ELLIOTT WAVE
Does Berkshire Hathaway Anticipate The Future?
03/29/17 03:58:09 PMby Koos van der Merwe
Everyone knows that Warren Buffett made his fortune buying and owning many businesses, as well as significant minority holdings in many companies. Can one use the movement of Berkshire Hathaway B shares as a trend guide?
Position: Accumulate
| Berkshire Hathaway averaged an annual growth in book value of 19.7% to its shareholders for the last 49 years (compared to 9.8% from the S&P 500 with dividends included for the same period). Berkshire Hathaway, Inc. has two classes of common stock, Class A and Class B. A share of Class B common stock has the rights of 1/1,500th of a share Class A common stock. A look at the Class B share is therefore similar to the movement of the Class A share which does reflect an investors opinion of the movement of the market. A chart can therefore be considered to be a conservative guide. |

|
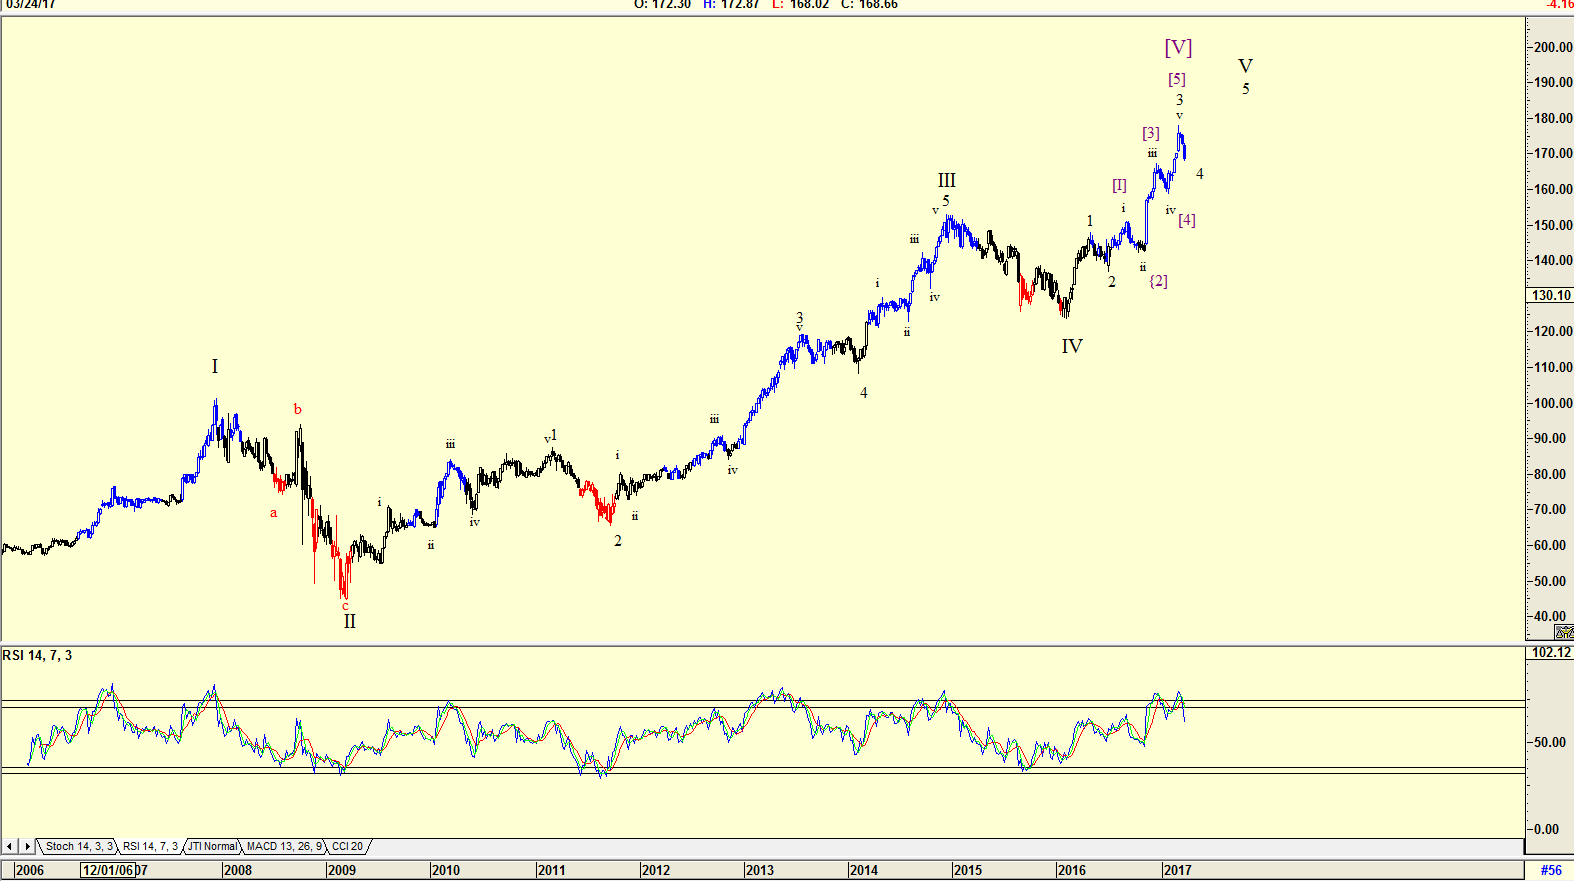
| Figure 1. Berkshire Hathaway Class B weekly chart. |
| Graphic provided by: AdvancedGET. |
| |
| The chart in Figure 1 is a weekly chart of Berkshire Hathaway Class B share with an Elliott wave count suggesting that the share price is tracing a wave 4 of a WAVE V. The RSI indicator, which has given a SELL signal, is suggesting that the Elliott wave count of WAVE V as shown on the chart could be wrong and that the wave 3 of WAVE V could be wave 5 of WAVE V as shown in purple on the chart, and that the share price should now start falling in an ABC correction. This uncertainty is very common at market tops as sophisticated investors sell the share while the unsophisticated investor buys at the market top. |

|
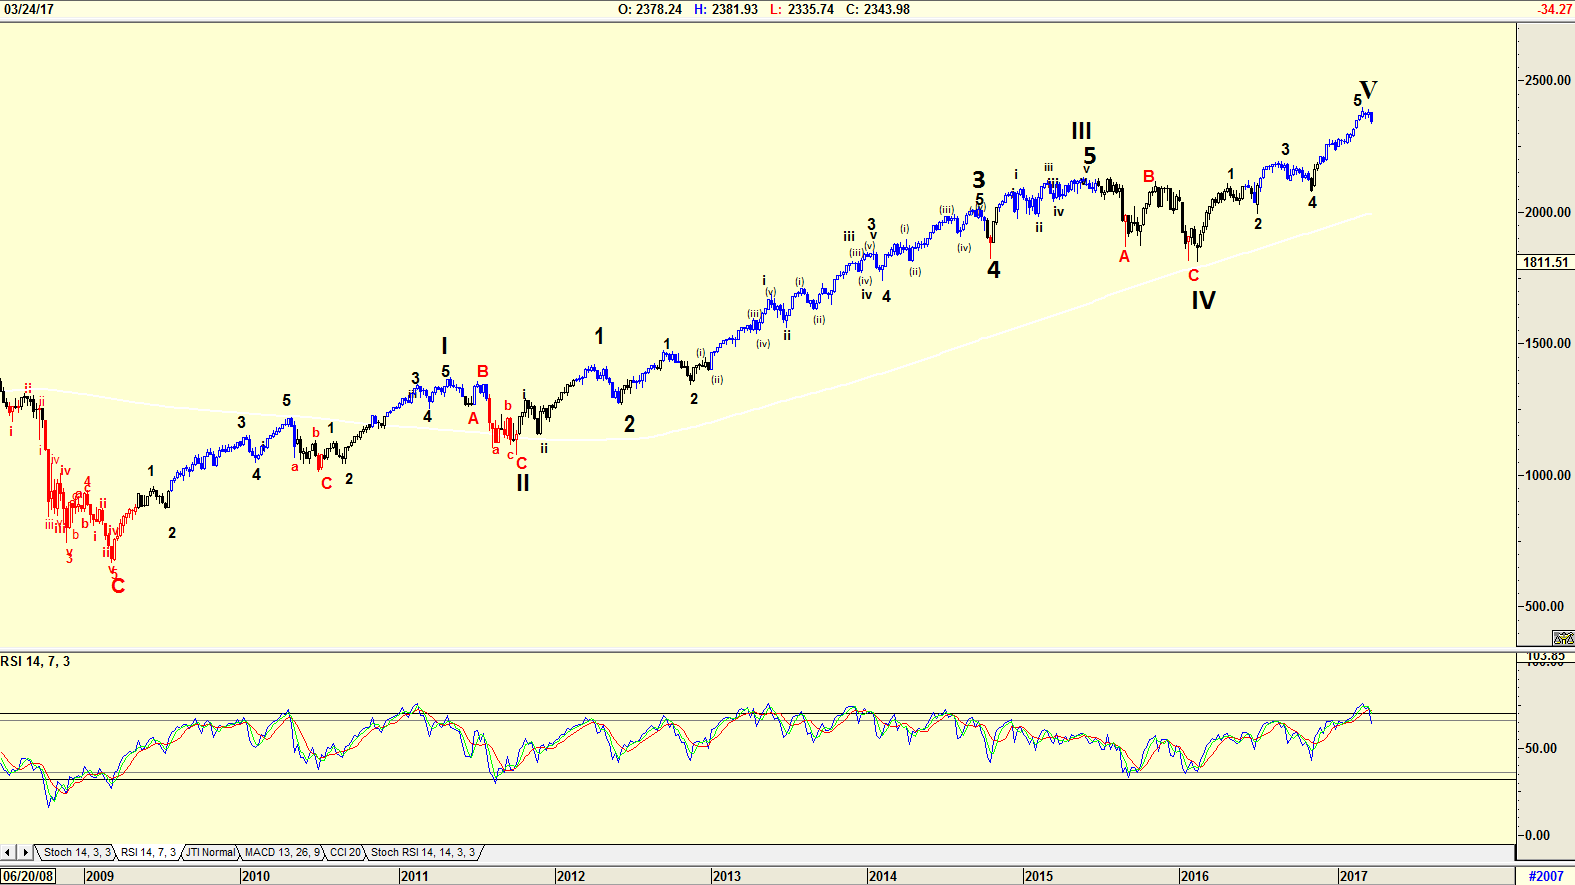
| Figure 2. Weekly chart of the S&P 500 Index. |
| Graphic provided by: AdvancedGET. |
| |
| A look at the weekly chart of the S&P 500 Index shows an Elliott wave count suggesting that a WAVE V has been completed and that the index could now be in a WAVE A correction. This is confirmed by the RSI indicator, which has given a SELL signal. However, once again the count could be wrong. Wave 3 of WAVE 5 as shown on the chart is less than Wave 1 of WAVE V. The Elliott wave rule is that if a Wave 3 is less than a Wave 1, then Wave 5 is smaller than Wave 3. With Wave 5 greater than Wave 3, the chart is therefore suggesting that the S&P 500 Index could rise higher. |

|
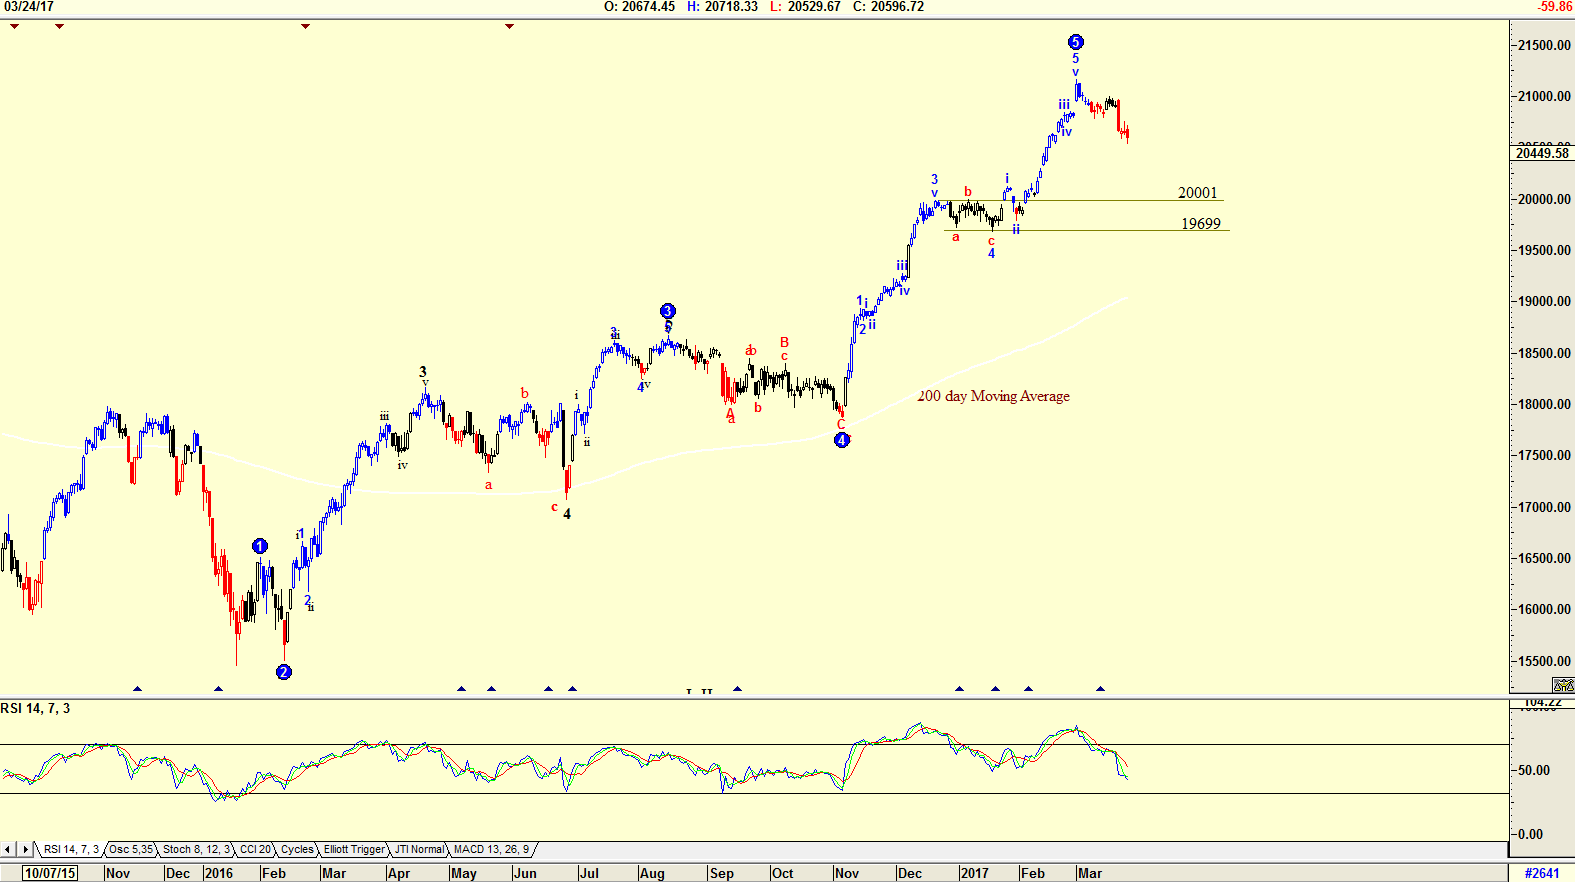
| Figure 3. Daily chart of the Dow Jones. |
| Graphic provided by: AdvancedGET. |
| |
| The chart in figure 3 is a daily chart of the Dow Jones, and the Elliott wave count is suggesting that WAVE 5 is complete, and that index could retrace to somewhere between 20001 and 19699, the 4th wave of lesser degree. The RSI index is suggesting further weakness. Many respectable analysts are starting to make public that they expect a major market meltdown in the future. One analyst even suggesting the date, June 1st 2017, as the day the meltdown will start. With the immigration policy of President Trump meeting resistance, and now with his healthcare bill's defeat, withdrawn because he could not receive a majority vote in Congress, uncertainty as to his success in governing America could start the market meltdown. One should, however, never forget that he is a businessman, not a politician, and that the education of becoming a politician could take many months because of his strong ego. Market uncertainty will therefore exist. Following the movement of Berkshire Hathaway B share price, could therefore be a solid guide as to the future movement of the Indexes. |
Has been a technical analyst since 1969, and has worked as a futures and options trader with First Financial Futures in Johannesburg, South Africa.
| Address: | 3256 West 24th Ave |
| Vancouver, BC | |
| Phone # for sales: | 6042634214 |
| E-mail address: | petroosp@gmail.com |
Click here for more information about our publications!
PRINT THIS ARTICLE

|

Request Information From Our Sponsors
- StockCharts.com, Inc.
- Candle Patterns
- Candlestick Charting Explained
- Intermarket Technical Analysis
- John Murphy on Chart Analysis
- John Murphy's Chart Pattern Recognition
- John Murphy's Market Message
- MurphyExplainsMarketAnalysis-Intermarket Analysis
- MurphyExplainsMarketAnalysis-Visual Analysis
- StockCharts.com
- Technical Analysis of the Financial Markets
- The Visual Investor
- VectorVest, Inc.
- Executive Premier Workshop
- One-Day Options Course
- OptionsPro
- Retirement Income Workshop
- Sure-Fire Trading Systems (VectorVest, Inc.)
- Trading as a Business Workshop
- VectorVest 7 EOD
- VectorVest 7 RealTime/IntraDay
- VectorVest AutoTester
- VectorVest Educational Services
- VectorVest OnLine
- VectorVest Options Analyzer
- VectorVest ProGraphics v6.0
- VectorVest ProTrader 7
- VectorVest RealTime Derby Tool
- VectorVest Simulator
- VectorVest Variator
- VectorVest Watchdog
