HOT TOPICS LIST
- MACD
- Fibonacci
- RSI
- Gann
- ADXR
- Stochastics
- Volume
- Triangles
- Futures
- Cycles
- Volatility
- ZIGZAG
- MESA
- Retracement
- Aroon
INDICATORS LIST
LIST OF TOPICS
PRINT THIS ARTICLE
by Koos van der Merwe
Shares of Tesla are very volatile. Are the shares worth a buy and hold?
Position: Accumulate
Koos van der Merwe
Has been a technical analyst since 1969, and has worked as a futures and options trader with First Financial Futures in Johannesburg, South Africa.
PRINT THIS ARTICLE
TECHNICAL ANALYSIS
Is Tesla A Buy?
03/15/17 04:06:28 PMby Koos van der Merwe
Shares of Tesla are very volatile. Are the shares worth a buy and hold?
Position: Accumulate
| Just about everybody would love to own a Tesla motorcar, simply because it runs on batteries and not gas. Elon Musk, Tesla's CEO is a go-getter. He is always on the go to improve the cars the company manufacturers, finding it against his personality to be content with the cars the company is presently producing. Last week, Tesla reported fourth quarter earnings, and once again did not make any money, although its loss was less than expected. Analysts question whether Tesla will be able to launch the $35,000 Model 3 on time later this year and ramp up production in 2018. Wall street is also struggling to figure out the company's acquisition of SolarCity. So, should you buy the share for a long term hold? |

|
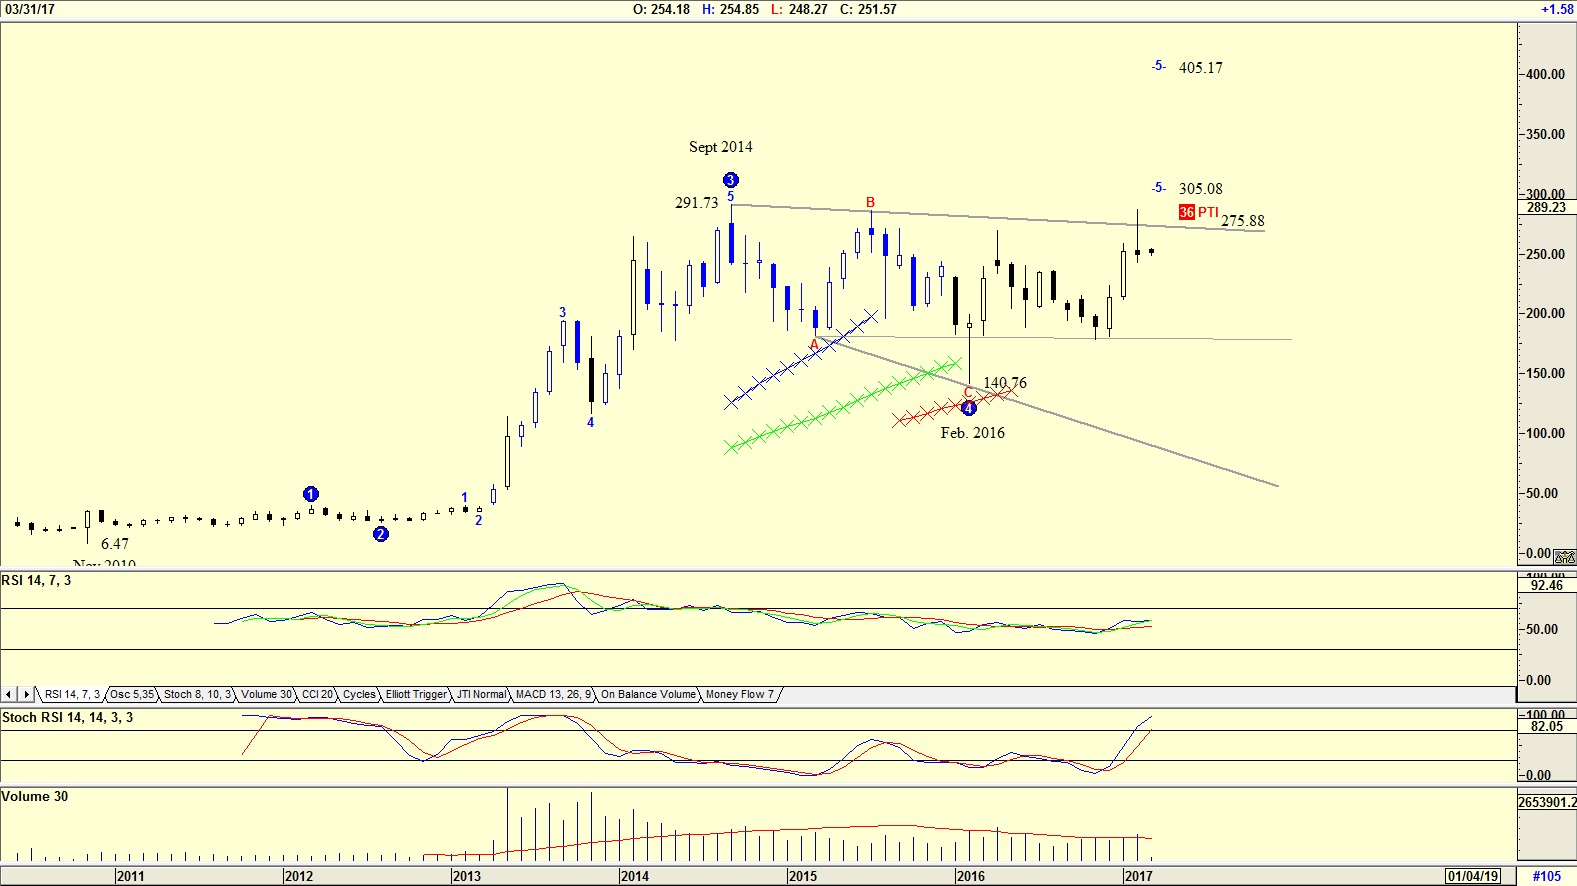
| Figure 1. Monthly chart of TSLA. |
| Graphic provided by: AdvancedGET. |
| |
| The chart in Figure 1 is a monthly chart showing how the share price rose from a low of $6.47 in November 2010 to a high of $291.73 by September 2014. Since then the share price has been trading in a sideways pattern. The chart has an Elliott wave count suggesting that the share price has completed a WAVE 4 and could now rise in a WAVE 5 to either $305.08 or $405.17. The PTI (probability Index) is 36, which is a low probability that this could occur. The resistance line suggests that should the share price rise above $275.88, this could occur. Both the RSI and Stochastic RSI are suggesting weakness. |

|
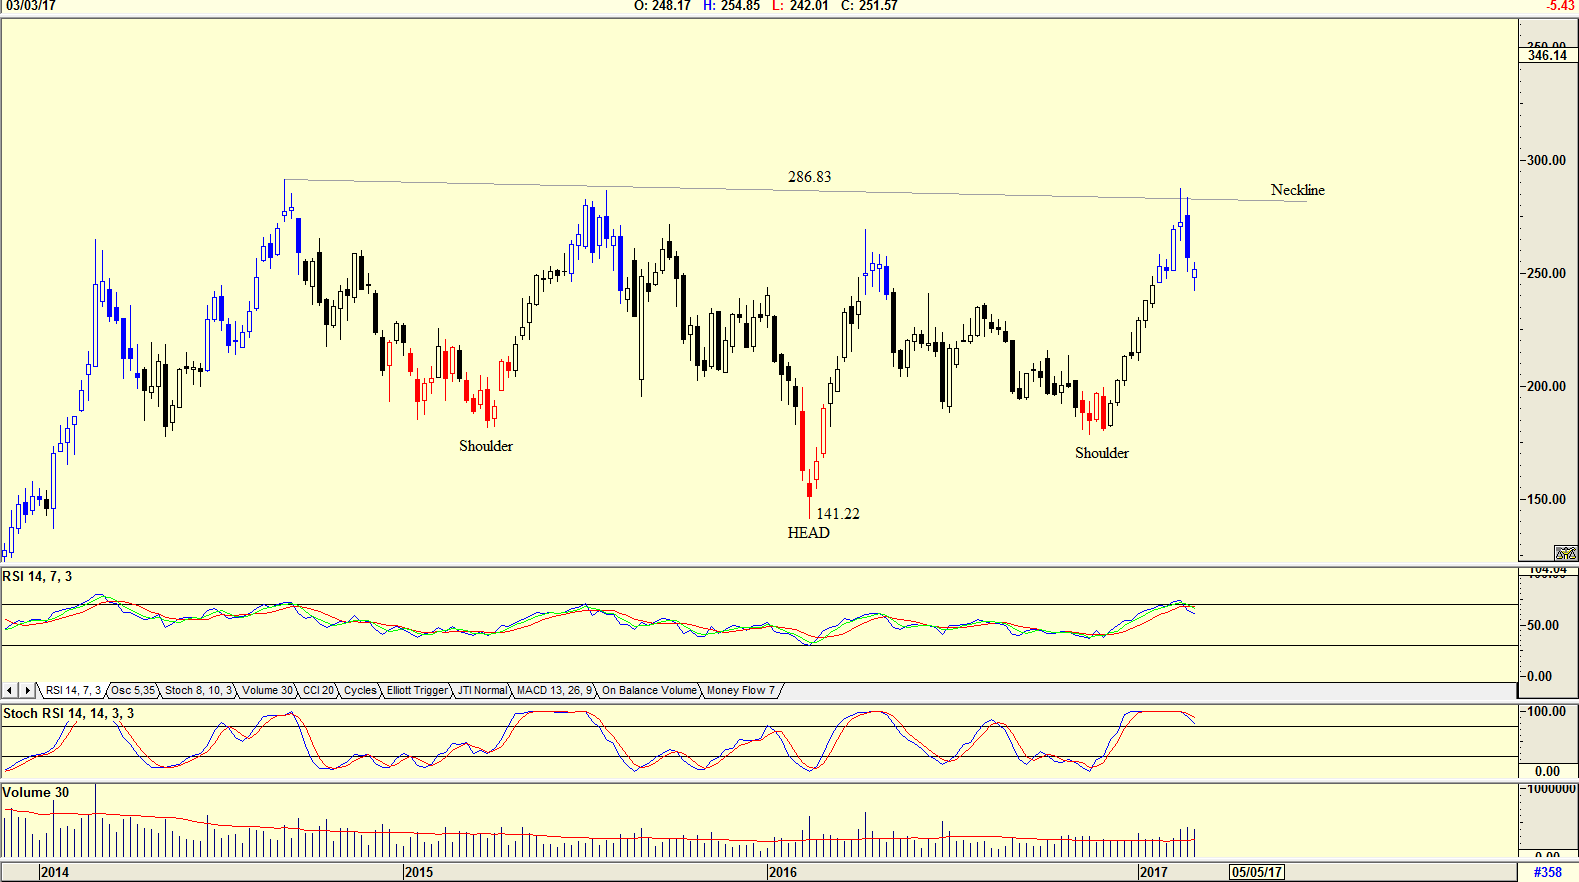
| Figure 2. Weekly chart of TSLA |
| Graphic provided by: AdvancedGET. |
| |
| The weekly chart shows that an inverse head and shoulder pattern has formed. This is suggesting a target of $432.44 (286.83-141.22=145.61. 286.83+145.61 = 432.44) should the price rise and break through the neckline. Both indicators are, however, suggesting weakness. Volume has also risen as the share price dropped also suggesting weakness. |

|
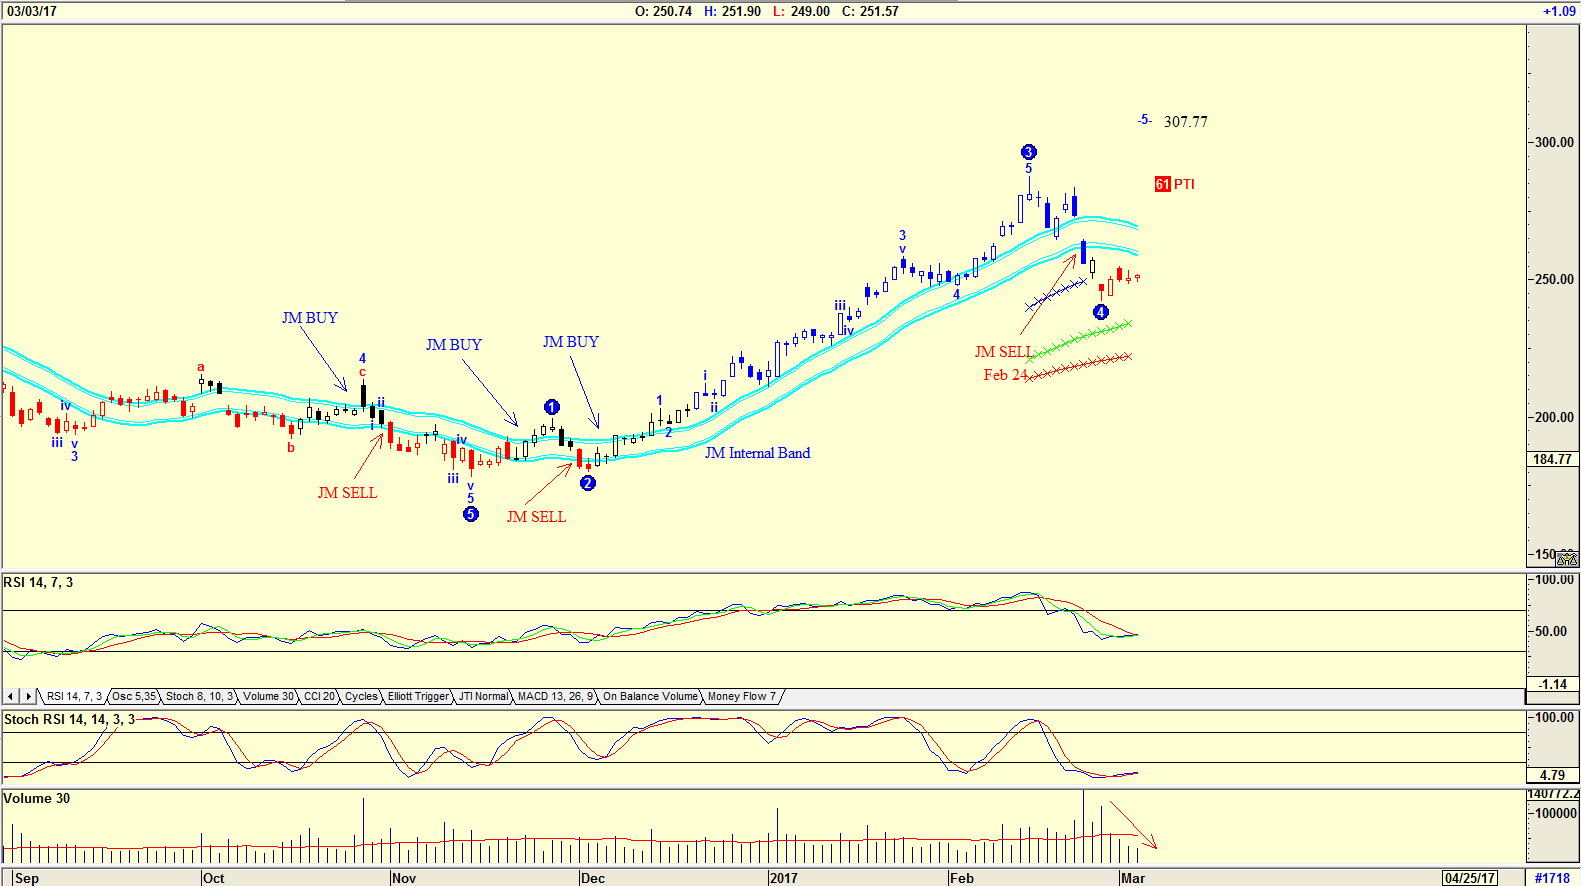
| Figure 3. Daily chart of TSLA. |
| Graphic provided by: AdvancedGET. |
| |
| The chart in Figure 3 is a daily chart with an Elliott wave count suggesting that the share price has completed a WAVE 4 and could now be rising in a WAVE 5, with a target of $307.77. The JM Internal Band is showing that the share price gave a sell signal on February 24th. The JM Internal Band is a 15-period simple moving average offset by 2% positive and 2% negative. A move above the upper band suggests a buy, and below the lower band, a sell. Conservative investors could wait for a break above the upper band before buying. Do note that the RSI indicator is still falling, while the Stochastic RSI is at oversold levels trending upward. Volume also fell as the share price fell, suggesting strength. Traders and investors appear to buying Elon Musk, not the share TSLA. There is no doubt that Elon Mush is another Steve Jobs, with ideas that will change the world. Buying Tesla shares, or shares in any other company Elon Musk owns or will own, is something a long term "lock in the safe and forget about it" investor would consider. |
Has been a technical analyst since 1969, and has worked as a futures and options trader with First Financial Futures in Johannesburg, South Africa.
| Address: | 3256 West 24th Ave |
| Vancouver, BC | |
| Phone # for sales: | 6042634214 |
| E-mail address: | petroosp@gmail.com |
Click here for more information about our publications!
PRINT THIS ARTICLE

|

Request Information From Our Sponsors
- StockCharts.com, Inc.
- Candle Patterns
- Candlestick Charting Explained
- Intermarket Technical Analysis
- John Murphy on Chart Analysis
- John Murphy's Chart Pattern Recognition
- John Murphy's Market Message
- MurphyExplainsMarketAnalysis-Intermarket Analysis
- MurphyExplainsMarketAnalysis-Visual Analysis
- StockCharts.com
- Technical Analysis of the Financial Markets
- The Visual Investor
- VectorVest, Inc.
- Executive Premier Workshop
- One-Day Options Course
- OptionsPro
- Retirement Income Workshop
- Sure-Fire Trading Systems (VectorVest, Inc.)
- Trading as a Business Workshop
- VectorVest 7 EOD
- VectorVest 7 RealTime/IntraDay
- VectorVest AutoTester
- VectorVest Educational Services
- VectorVest OnLine
- VectorVest Options Analyzer
- VectorVest ProGraphics v6.0
- VectorVest ProTrader 7
- VectorVest RealTime Derby Tool
- VectorVest Simulator
- VectorVest Variator
- VectorVest Watchdog
