HOT TOPICS LIST
- MACD
- Fibonacci
- RSI
- Gann
- ADXR
- Stochastics
- Volume
- Triangles
- Futures
- Cycles
- Volatility
- ZIGZAG
- MESA
- Retracement
- Aroon
INDICATORS LIST
LIST OF TOPICS
PRINT THIS ARTICLE
by Koos van der Merwe
The share, Johnson and Johnson, is rated as one of top recommendations.
Position: Sell
Koos van der Merwe
Has been a technical analyst since 1969, and has worked as a futures and options trader with First Financial Futures in Johannesburg, South Africa.
PRINT THIS ARTICLE
TECHNICAL INDICATORS
A Look At Johnson And Johnson
03/10/17 03:27:44 PMby Koos van der Merwe
The share, Johnson and Johnson, is rated as one of top recommendations.
Position: Sell
| Shares of Johnson and Johnson is one of the eleven top recommendations. Buying and holding the share forever is the way to go, but buying it at the moment could be the wrong thing. One should only buy at the bottom and sell at the top. With the election of President Donald Trump, the stock market has gone extremely bullish, with the Dow making new highs every day. WD Gann said that the trend is 7 days up, 3 days down then 7 days up. The present uptrend of the Dow has caused one to question this, but as I have argued before, computers that are more and more trading the stock market do not have emotions, so WD Gann's theory may now have become history. Of course, with President Donald Trump recently refusing entry of certain news agencies into his meetings, who knows what can happen. Only dictators control the press and America is a Democratic country, not another Russia. |

|
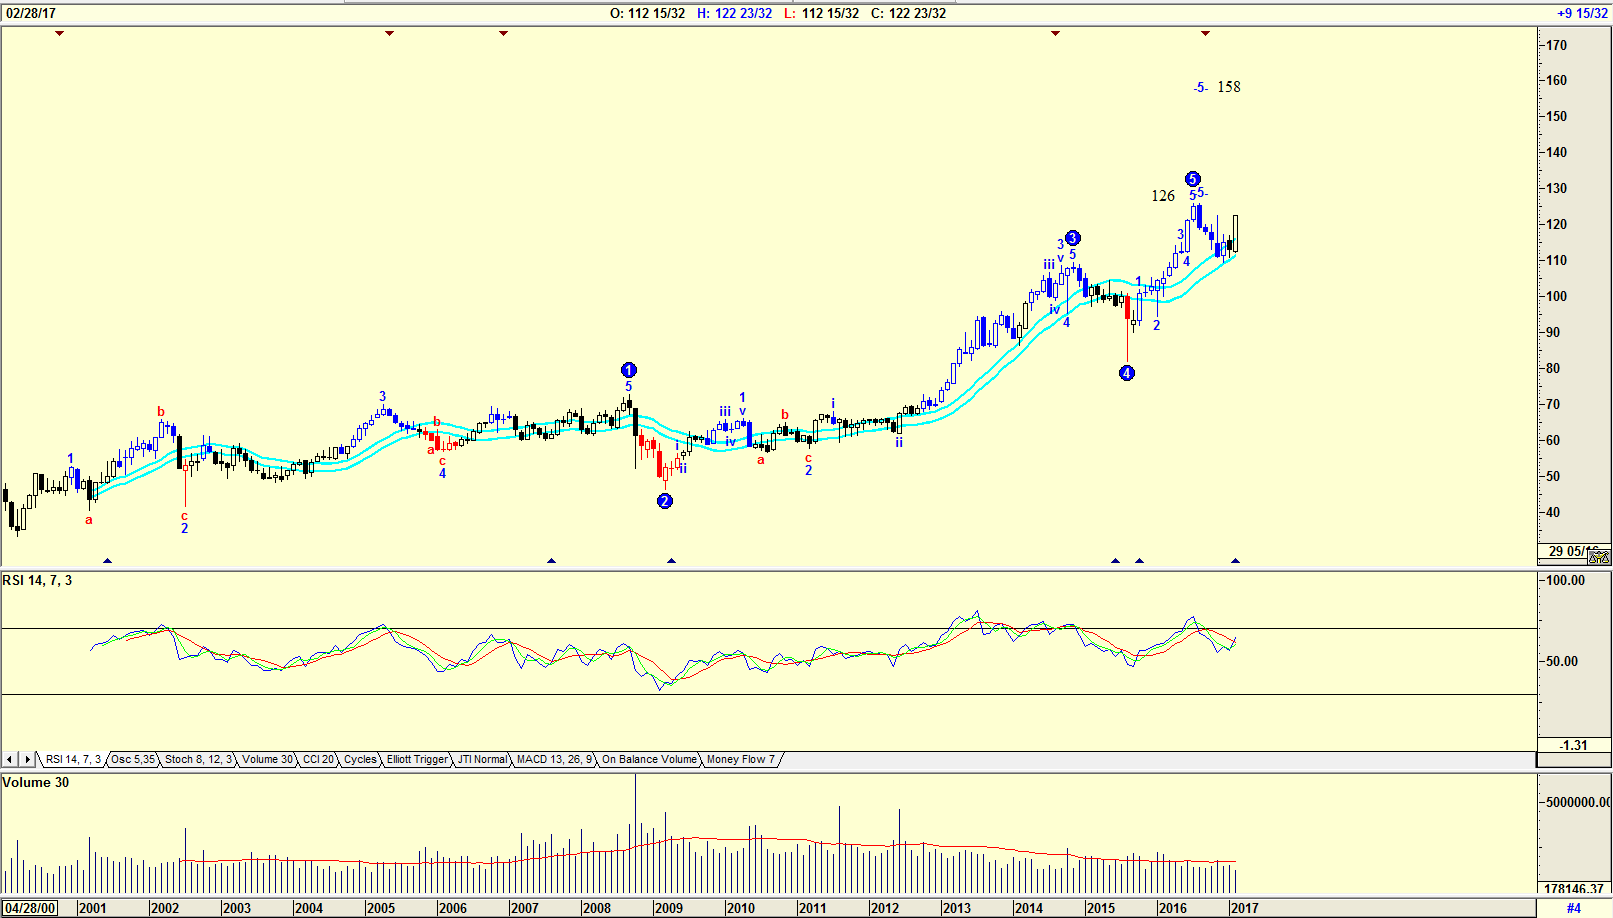
| Figure 1. Monthly chart with Elliott wave count. |
| Graphic provided by: AdvancedGET. |
| |
| The chart in Figure 1 is a monthly chart of Johnson and Johnson with an Elliott wave count suggesting that the share price may have topped at $126 but could rise to $158 in an Elliott Wave 5. Volume however has been dropping as the share price rose, a sign of weakness. The RSI 14 indicator is also at oversold levels but where it was trending down, it has now ticked up, suggesting that the price could rise to the $158 level. |

|
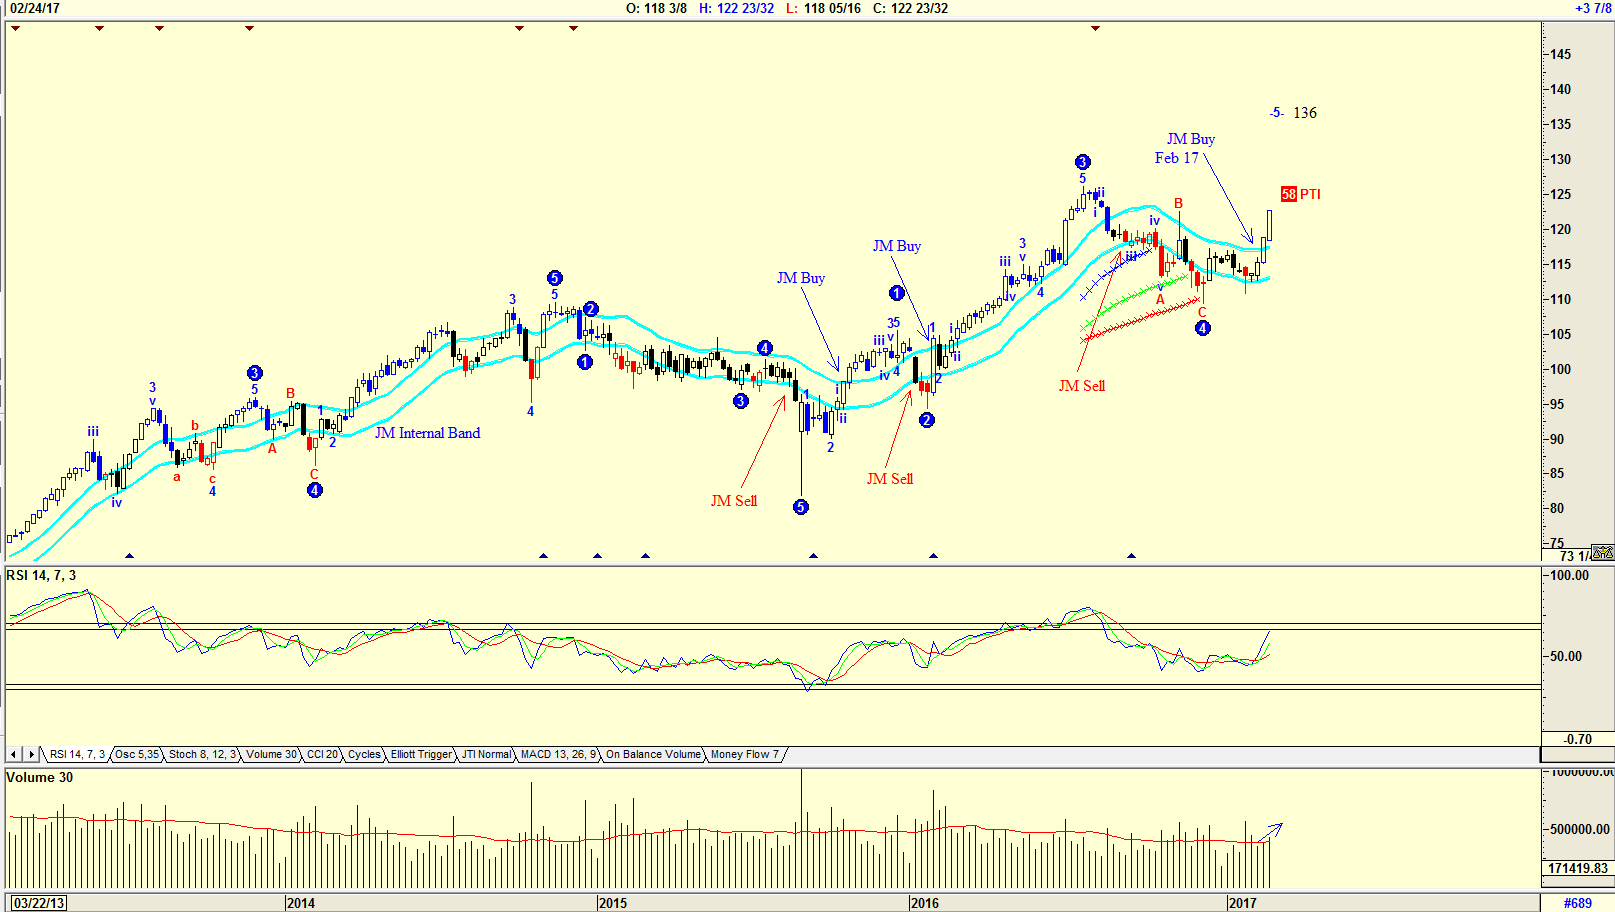
| Figure 2. Weekly chart with Elliott wave count and JM Internal Band. |
| Graphic provided by: AdvancedGET. |
| |
| The chart in Figure 2 is a weekly chart with an Elliott wave count suggesting that the share price should rise to $136 in a Wave 5. The PTI indicator (probability indicator) suggests that this could happen. I have included the JM Internal Band indicator on this weekly chart showing that a buy signal was given on February 17th. The JM Internal Band is a 15-period simple moving average offset by 2% positive and 2% negative. A move above the upper band suggests a buy and below the lower band a sell. Volume also strengthened as the share price rose over the past three weeks, a positive sign. |

|
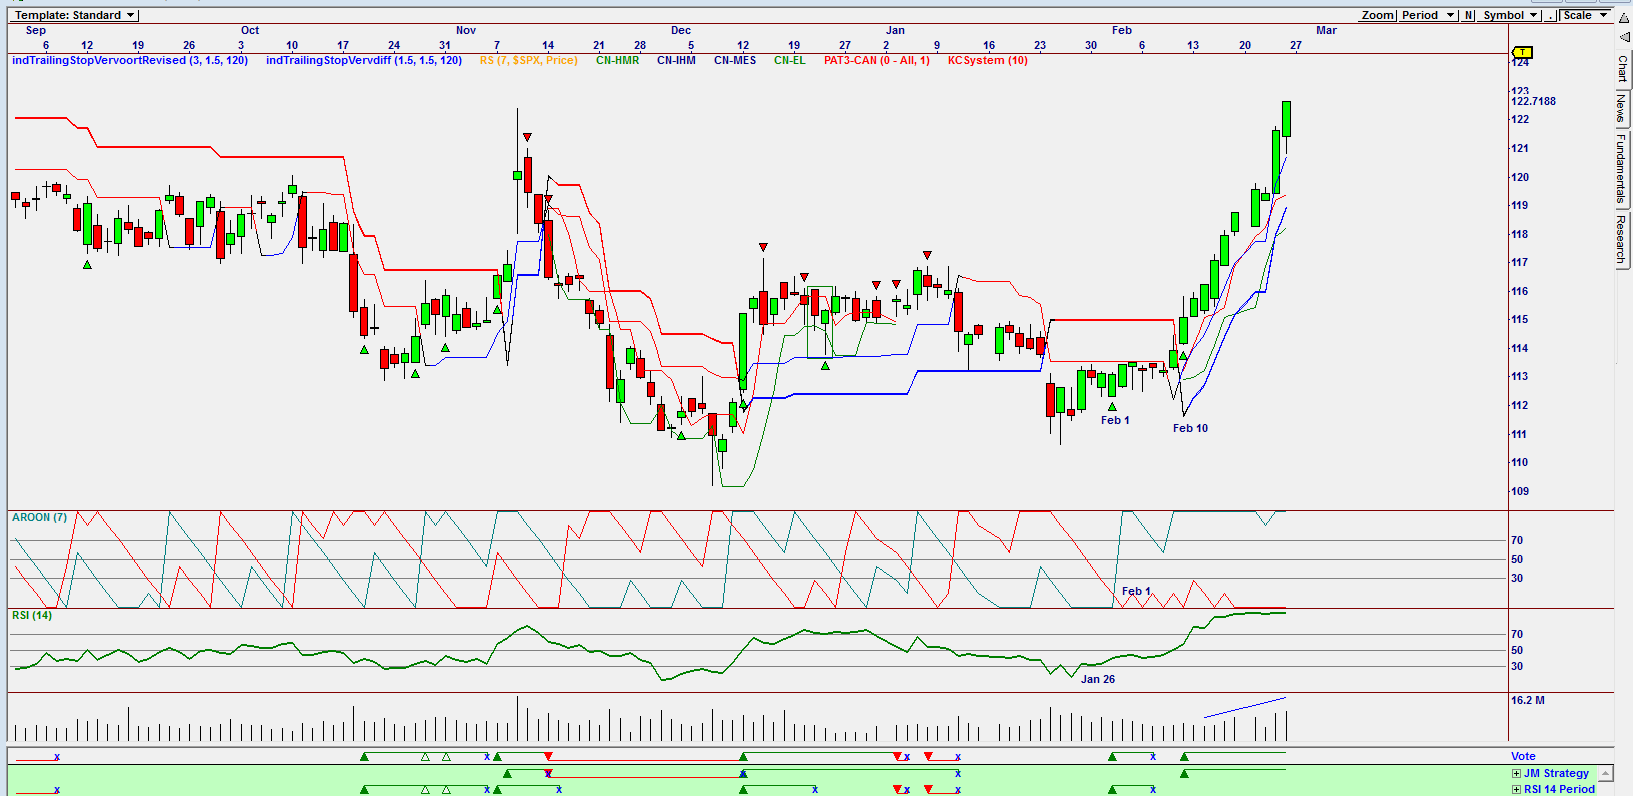
| Figure 3. Daily Omnitrader chart. |
| Graphic provided by: Omnitrader. |
| |
| The chart in Figure 3 is an Omnitrader chart showing a buy signal given on February 1st and February 10th. Volume has risen, confirming strength, and the RSI indicator is at oversold levels but has not yet given a sell. Do note the Aroon Indicator which gave a buy signal on Feb 1st, whereas the RSI indicator suggested a buy on January 26th. Yes, a buy of JNJ looks very tempting at the moment, but I would rather place the share on my watch list, waiting for a correction to occur and buying on that correction. The market rise as President Trump took office will come to an end. Nothing goes up forever. |
Has been a technical analyst since 1969, and has worked as a futures and options trader with First Financial Futures in Johannesburg, South Africa.
| Address: | 3256 West 24th Ave |
| Vancouver, BC | |
| Phone # for sales: | 6042634214 |
| E-mail address: | petroosp@gmail.com |
Click here for more information about our publications!
Comments

Request Information From Our Sponsors
- StockCharts.com, Inc.
- Candle Patterns
- Candlestick Charting Explained
- Intermarket Technical Analysis
- John Murphy on Chart Analysis
- John Murphy's Chart Pattern Recognition
- John Murphy's Market Message
- MurphyExplainsMarketAnalysis-Intermarket Analysis
- MurphyExplainsMarketAnalysis-Visual Analysis
- StockCharts.com
- Technical Analysis of the Financial Markets
- The Visual Investor
- VectorVest, Inc.
- Executive Premier Workshop
- One-Day Options Course
- OptionsPro
- Retirement Income Workshop
- Sure-Fire Trading Systems (VectorVest, Inc.)
- Trading as a Business Workshop
- VectorVest 7 EOD
- VectorVest 7 RealTime/IntraDay
- VectorVest AutoTester
- VectorVest Educational Services
- VectorVest OnLine
- VectorVest Options Analyzer
- VectorVest ProGraphics v6.0
- VectorVest ProTrader 7
- VectorVest RealTime Derby Tool
- VectorVest Simulator
- VectorVest Variator
- VectorVest Watchdog
