HOT TOPICS LIST
- MACD
- Fibonacci
- RSI
- Gann
- ADXR
- Stochastics
- Volume
- Triangles
- Futures
- Cycles
- Volatility
- ZIGZAG
- MESA
- Retracement
- Aroon
INDICATORS LIST
LIST OF TOPICS
PRINT THIS ARTICLE
by Koos van der Merwe
Apple to start India manufacturing soon.
Position: Sell
Koos van der Merwe
Has been a technical analyst since 1969, and has worked as a futures and options trader with First Financial Futures in Johannesburg, South Africa.
PRINT THIS ARTICLE
ELLIOTT WAVE
Is It Time To Bite Apple?
03/01/17 03:59:35 PMby Koos van der Merwe
Apple to start India manufacturing soon.
Position: Sell
| Apple India has announced that it will start assembling iPhones in India starting April 2017. Because of Chinese labor costs rising, it may also shift some of its Chinese manufacturing units to India. What is interesting is that Apple will continue to manufacture its iPhone outside of America in spite of President Donald Trump's statements that American companies must start moving their manufacturing back to America. This is surprising, but Tim Cook, who became CEO of Apple in August 2011, met and spoke to the President. He defended his meeting with Donald Trump, arguing that the only way to influence the President was to engage with him. "You change things by showing everyone why your way is the best. In many ways, it's a debate of ideas." Apple shares have been rising strongly since the meeting but, and here is the question, is it still time to buy Apple shares? |

|
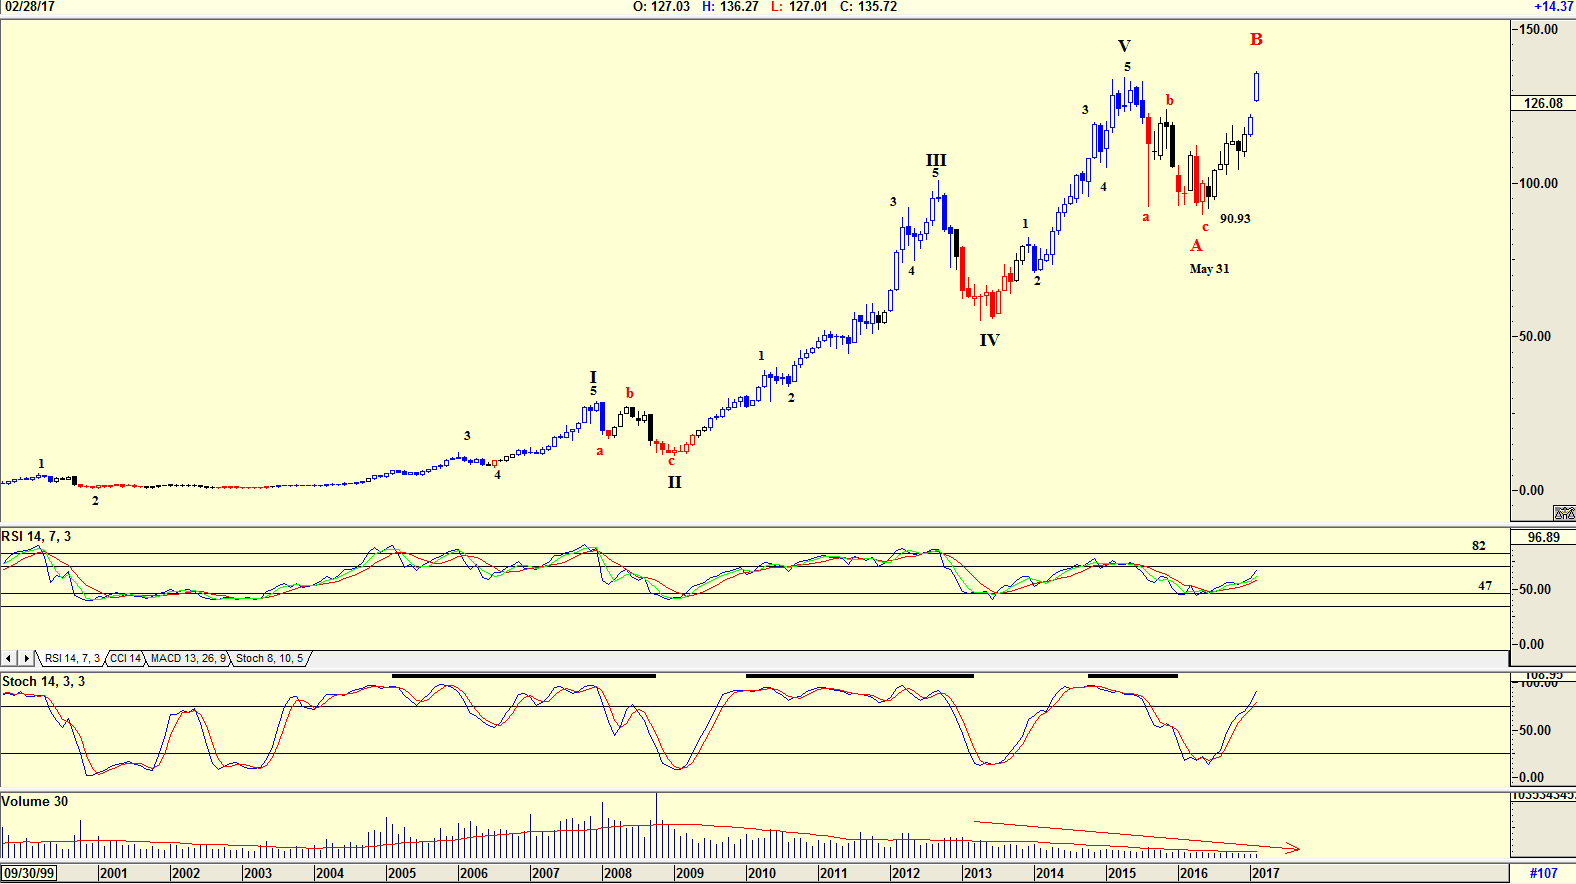
| Figure 1. Monthly chart of AAPL. |
| Graphic provided by: AdvancedGET. |
| |
| The chart in Figure 1 is a monthly chart of Apple, with an Elliott wave count suggesting that the share is in a B-WAVE correction. If this Elliott wave count is correct, then the share price will collapse in a major C-WAVE, in the near future. What makes one doubt the Elliott wave count are the two indicators shown. The RSI and Stochastic. Both indicators have not given a sell signal, suggesting that the price could rise further. Yes, B-WAVES have been known to rise above the high of a WAVE V, but it is not that common, and often leads to a change in the Elliott wave count. Do note that volume has been falling as the share price rose, suggesting weakness ahead. |

|
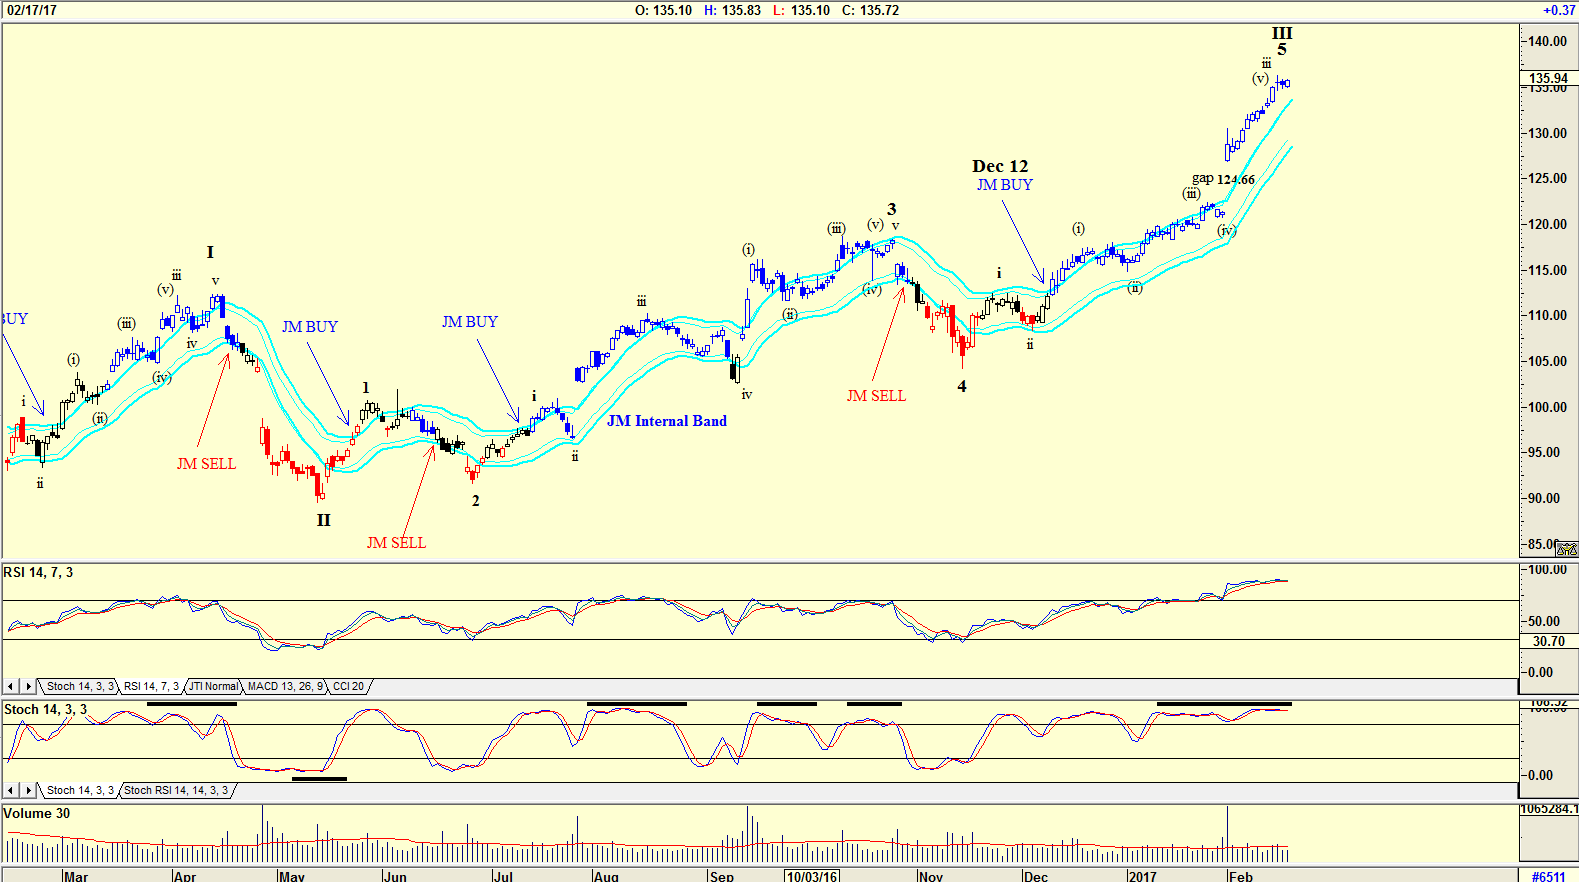
| Figure 2. Daily chart of AAPL. |
| Graphic provided by: AdvancedGET. |
| |
| The chart in Figure 2 is a daily chart with an Elliott wave count suggesting that the share price could still rise further in a wave v of Wave 5 of WAVE III. However, both indicators are at overbought levels, but have not yet given a sell signal. Note also that the JM Internal Band gave a buy on December 12, 2016. The JM Internal band is a 15 day simple moving average offset by 2% positive and 2% negative. Apple shares do look overbought at the moment and due for a correction. The reason for the correction can be anything, from a Presidential order that all US companies must return all manufacturing to the USA, or simply a strong market correction that is overdue. The Gap shown on the chart suggests that the share price could fall to $124.66 before rising to complete the Wave 5 of WAVE III. |
Has been a technical analyst since 1969, and has worked as a futures and options trader with First Financial Futures in Johannesburg, South Africa.
| Address: | 3256 West 24th Ave |
| Vancouver, BC | |
| Phone # for sales: | 6042634214 |
| E-mail address: | petroosp@gmail.com |
Click here for more information about our publications!
PRINT THIS ARTICLE

Request Information From Our Sponsors
- VectorVest, Inc.
- Executive Premier Workshop
- One-Day Options Course
- OptionsPro
- Retirement Income Workshop
- Sure-Fire Trading Systems (VectorVest, Inc.)
- Trading as a Business Workshop
- VectorVest 7 EOD
- VectorVest 7 RealTime/IntraDay
- VectorVest AutoTester
- VectorVest Educational Services
- VectorVest OnLine
- VectorVest Options Analyzer
- VectorVest ProGraphics v6.0
- VectorVest ProTrader 7
- VectorVest RealTime Derby Tool
- VectorVest Simulator
- VectorVest Variator
- VectorVest Watchdog
- StockCharts.com, Inc.
- Candle Patterns
- Candlestick Charting Explained
- Intermarket Technical Analysis
- John Murphy on Chart Analysis
- John Murphy's Chart Pattern Recognition
- John Murphy's Market Message
- MurphyExplainsMarketAnalysis-Intermarket Analysis
- MurphyExplainsMarketAnalysis-Visual Analysis
- StockCharts.com
- Technical Analysis of the Financial Markets
- The Visual Investor
