HOT TOPICS LIST
- MACD
- Fibonacci
- RSI
- Gann
- ADXR
- Stochastics
- Volume
- Triangles
- Futures
- Cycles
- Volatility
- ZIGZAG
- MESA
- Retracement
- Aroon
INDICATORS LIST
LIST OF TOPICS
PRINT THIS ARTICLE
by David Penn
A descending triangle in December wheat may signal the break for which the bears have awaited ...
Position: N/A
David Penn
Technical Writer for Technical Analysis of STOCKS & COMMODITIES magazine, Working-Money.com, and Traders.com Advantage.
PRINT THIS ARTICLE
DESCENDING TRIANGLES
Triangle Trouble for Wheat Futures
12/03/02 10:24:40 AMby David Penn
A descending triangle in December wheat may signal the break for which the bears have awaited ...
Position: N/A
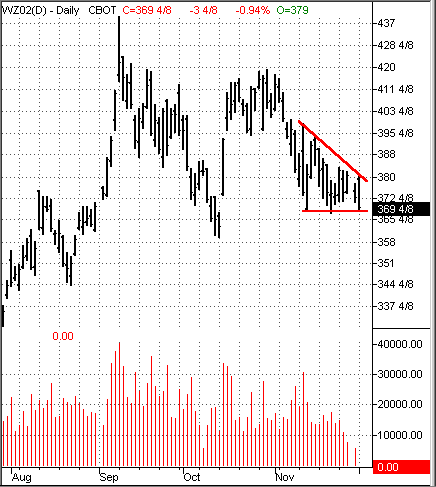
| I've made a few recent noises about the apparent top in grain futures (see my "1-2-3 Reversals and Commodities," Traders.com Advantage, November 26, 2002). Recent price action in December wheat seems to underscore the bearishness of these futures, particularly since early September. In looking at the potential downside in December wheat, I noted a descending triangle over the month of November -- one that points to declines in December wheat as being more likely than renewed advances. |
| First, the case for the top in December wheat is predicated on the price spike in early September, a spike that took December wheat futures above 437. Prices retreated sharply after this point, spending the rest of September in decline and putting in an intermediate bottom in early October around 360. This decline was the first sign of major trouble for December wheat. The second sign came as December wheat rallied into mid-October. When prices consolidated between 420 and 395, there was perhaps an equal chance of December wheat futures continuing their rally as resuming their downtrend. But as November arrived, December wheat began to decline again, suggesting that the risks had definitely shifted against the bulls--even if December wheat was not, at this point, an obvious short. |

|
| This descending triangle may set the stage for December wheat's next leg down. |
| Graphic provided by: TradeStation. |
| |
| Second, the November declines set the stage for the descending triangle. The case for the descending triangle comes on the back of the steadily lowering highs December wheat has made since early in November. As for the horizontal support line, we can spot support developing along the lows of November 13th, the 21st and on December 2nd. This support is about ten points above the correction low in October, which was made as December wheat fell from its contract highs just north of 437 early in September. Nevertheless, this support seems significant and, if broken, will suggest that strong technical damage has been inflicted. |
| What is the downside of a break beneath support at the 370 level? Given a formation size of about 396, a downside break in December wheat's descending triangle could take the contract down 25 points or more to the 345 level. This area actually might provide some support, primarily in the form of the August correction lows of about 344 4/8. |
Technical Writer for Technical Analysis of STOCKS & COMMODITIES magazine, Working-Money.com, and Traders.com Advantage.
| Title: | Technical Writer |
| Company: | Technical Analysis, Inc. |
| Address: | 4757 California Avenue SW |
| Seattle, WA 98116 | |
| Phone # for sales: | 206 938 0570 |
| Fax: | 206 938 1307 |
| Website: | www.Traders.com |
| E-mail address: | DPenn@traders.com |
Traders' Resource Links | |
| Charting the Stock Market: The Wyckoff Method -- Books | |
| Working-Money.com -- Online Trading Services | |
| Traders.com Advantage -- Online Trading Services | |
| Technical Analysis of Stocks & Commodities -- Publications and Newsletters | |
| Working Money, at Working-Money.com -- Publications and Newsletters | |
| Traders.com Advantage -- Publications and Newsletters | |
| Professional Traders Starter Kit -- Software | |
Click here for more information about our publications!
Comments
Date: 12/05/02Rank: 5Comment:

Request Information From Our Sponsors
- StockCharts.com, Inc.
- Candle Patterns
- Candlestick Charting Explained
- Intermarket Technical Analysis
- John Murphy on Chart Analysis
- John Murphy's Chart Pattern Recognition
- John Murphy's Market Message
- MurphyExplainsMarketAnalysis-Intermarket Analysis
- MurphyExplainsMarketAnalysis-Visual Analysis
- StockCharts.com
- Technical Analysis of the Financial Markets
- The Visual Investor
- VectorVest, Inc.
- Executive Premier Workshop
- One-Day Options Course
- OptionsPro
- Retirement Income Workshop
- Sure-Fire Trading Systems (VectorVest, Inc.)
- Trading as a Business Workshop
- VectorVest 7 EOD
- VectorVest 7 RealTime/IntraDay
- VectorVest AutoTester
- VectorVest Educational Services
- VectorVest OnLine
- VectorVest Options Analyzer
- VectorVest ProGraphics v6.0
- VectorVest ProTrader 7
- VectorVest RealTime Derby Tool
- VectorVest Simulator
- VectorVest Variator
- VectorVest Watchdog
