HOT TOPICS LIST
- MACD
- Fibonacci
- RSI
- Gann
- ADXR
- Stochastics
- Volume
- Triangles
- Futures
- Cycles
- Volatility
- ZIGZAG
- MESA
- Retracement
- Aroon
INDICATORS LIST
LIST OF TOPICS
PRINT THIS ARTICLE
by Stella Osoba, CMT
The chart of Fabrinet (FN) has not been an easy read. After reaching a high of 46.50 on October 5, 2016, it began to move lower, making a series of lower highs and lower lows, but a breakout to a new high of 47.50 on February 13, 2017, causes us to reconsider this chart and ask, is now a good time to be long FN?
Position: N/A
Stella Osoba, CMT
Stella Osoba is a trader and financial writer. She is a frequent contributor to "Technical Analysis of Stocks and Commodities" magazine and "Traders.com Advantage" as well as other financial publications.
PRINT THIS ARTICLE
TECHNICAL ANALYSIS
A Quick Read of Fabrinet
03/01/17 03:53:15 PMby Stella Osoba, CMT
The chart of Fabrinet (FN) has not been an easy read. After reaching a high of 46.50 on October 5, 2016, it began to move lower, making a series of lower highs and lower lows, but a breakout to a new high of 47.50 on February 13, 2017, causes us to reconsider this chart and ask, is now a good time to be long FN?
Position: N/A
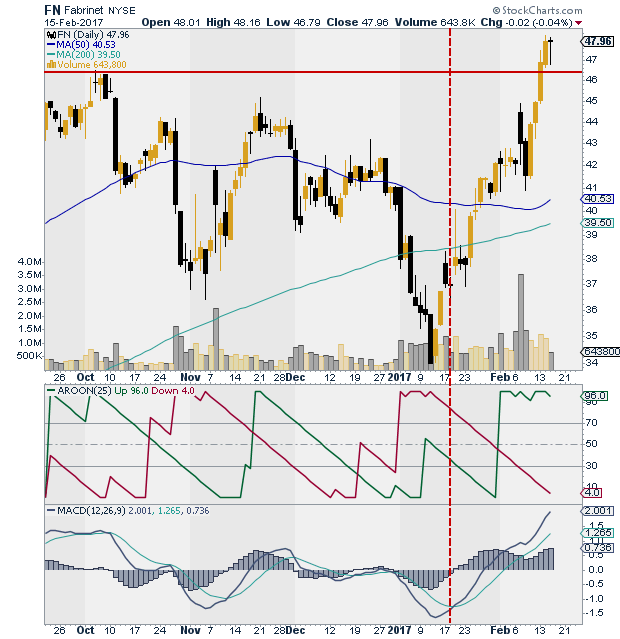
| FN, the fiber-optics stock, reported better than expected second quarter earnings at the close of trading on February 13, 2017, and the stock reacted positively. A strong bullish candle broke through resistance (see chart). The stock has since reached a high of 48.26. February 15, 2017 saw a pause in the strong upwards momentum as FN formed a doji. But technical signals are pointing to a continuation of the strong performance. |

|
| Figure 1. Daily chart for FN with AROON and MACD indicators. |
| Graphic provided by: StockCharts.com. |
| |
| The 50-day moving average which had begun to slope downwards is beginning to turn up. The stock is well above both its 200-day and 50-day moving averages. Volume on up days is well above average and on down days volume retreats as it should in a healthy uptrend. The Aroon-up (green) line is close to 100, indicating a strong trend is emerging. The Arron-down line (red) is falling and is currently close to 10, which is positive confirmation of the up-trend. |
| The MACD is well above its zero line with the MACD line above its signal line. There is an indication that though the readings are positive, FN might be due for a reaction. The MACD histogram is also in positive territory. Note that if you were using a MACD signal line crossover entry system, you would have gone long the stock on January 18, 2017 (see chart: red dotted line). |
| For those looking to take a new long position in FN, pay close attention to the coming reaction. If the stock does not break below any support levels, a long trade might indeed be a good idea. |
Stella Osoba is a trader and financial writer. She is a frequent contributor to "Technical Analysis of Stocks and Commodities" magazine and "Traders.com Advantage" as well as other financial publications.
| E-mail address: | stellaosoba@gmail.com |
Click here for more information about our publications!
PRINT THIS ARTICLE

Request Information From Our Sponsors
- StockCharts.com, Inc.
- Candle Patterns
- Candlestick Charting Explained
- Intermarket Technical Analysis
- John Murphy on Chart Analysis
- John Murphy's Chart Pattern Recognition
- John Murphy's Market Message
- MurphyExplainsMarketAnalysis-Intermarket Analysis
- MurphyExplainsMarketAnalysis-Visual Analysis
- StockCharts.com
- Technical Analysis of the Financial Markets
- The Visual Investor
- VectorVest, Inc.
- Executive Premier Workshop
- One-Day Options Course
- OptionsPro
- Retirement Income Workshop
- Sure-Fire Trading Systems (VectorVest, Inc.)
- Trading as a Business Workshop
- VectorVest 7 EOD
- VectorVest 7 RealTime/IntraDay
- VectorVest AutoTester
- VectorVest Educational Services
- VectorVest OnLine
- VectorVest Options Analyzer
- VectorVest ProGraphics v6.0
- VectorVest ProTrader 7
- VectorVest RealTime Derby Tool
- VectorVest Simulator
- VectorVest Variator
- VectorVest Watchdog
