

HOT TOPICS LIST
- MACD
- Fibonacci
- RSI
- Gann
- ADXR
- Stochastics
- Volume
- Triangles
- Futures
- Cycles
- Volatility
- ZIGZAG
- MESA
- Retracement
- Aroon
INDICATORS LIST
LIST OF TOPICS
PRINT THIS ARTICLE
by Koos van der Merwe
Finding a stock to buy and hold is not that easy at the moment.
Position: Buy
Koos van der Merwe
Has been a technical analyst since 1969, and has worked as a futures and options trader with First Financial Futures in Johannesburg, South Africa.
PRINT THIS ARTICLE
TECHNICAL ANALYSIS
A LOOK AT GENERAL ELECTRIC.
02/15/17 03:56:05 PMby Koos van der Merwe
Finding a stock to buy and hold is not that easy at the moment.
Position: Buy
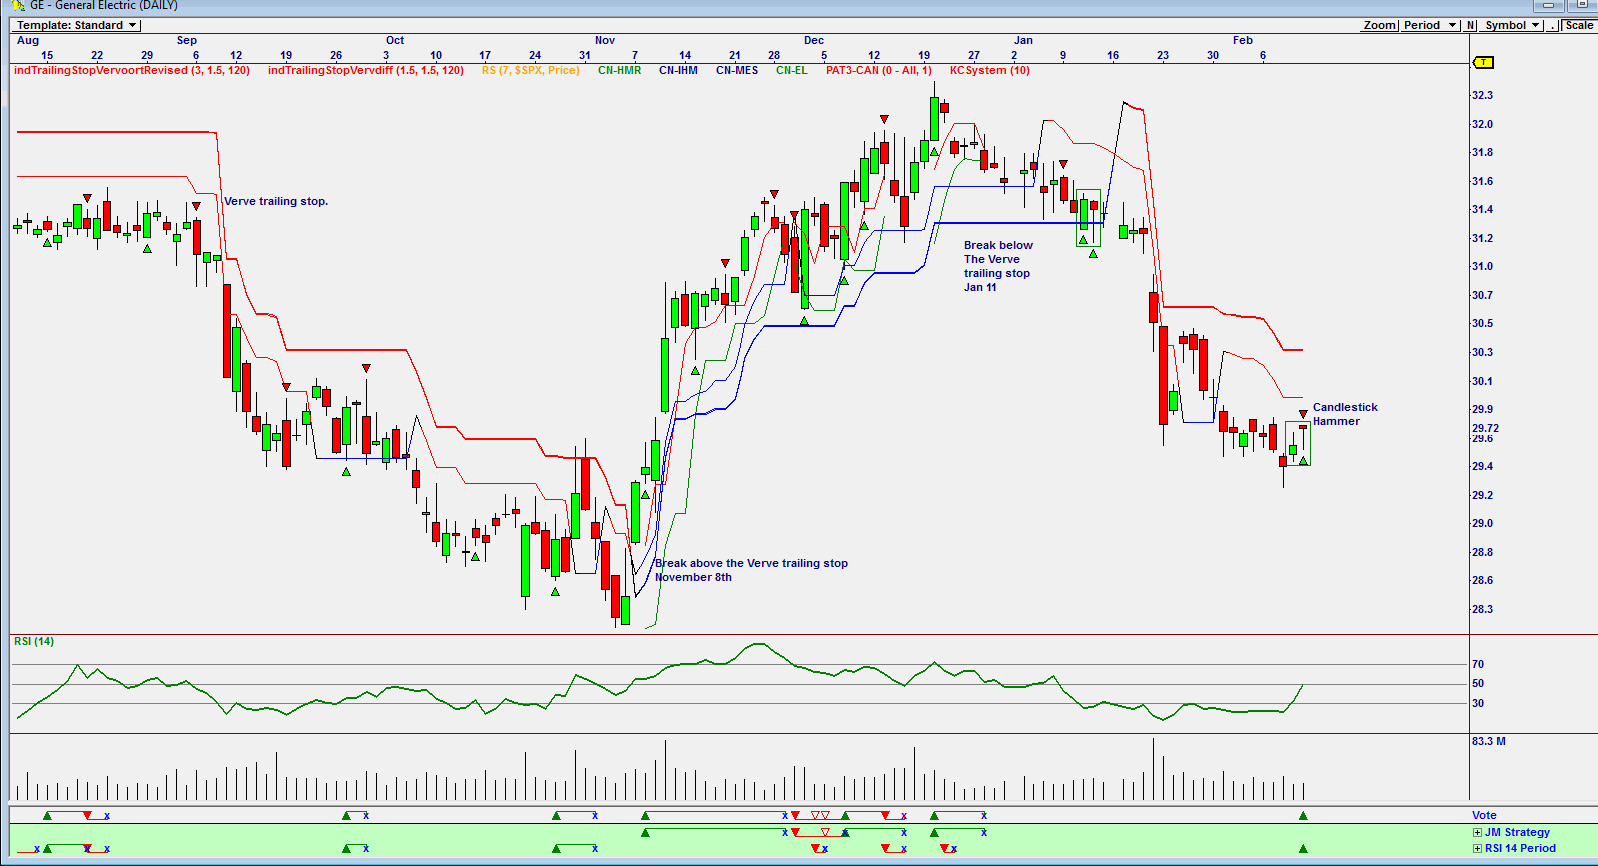
| Analyzing a share with technical analysis is the way to go, especially when you have an analytical program that looks at and analyzes the entire share market, highlighting those shares that fit the parameters you set up. General Electric is a share that came to my attention as a possible buy using an analytical program. So, do you go ahead and just buy it, or do you analyze it further. |
|
| Figure 1. Daily chart of GE showing a buy signal. |
| Graphic provided by: Omnitrader. |
| |
| The chart in Figure 1 is an Omnitrader chart of General Electric. The strategies used, as shown below the Vote line, is the JM strategy and the RSI14 strategy. The JM strategy is based on the JM Internal band which is a 15 period simple moving average offset by 2% plus and 2% minus. A move above the upper band suggests a buy, and below the lower band a sell. Preparing an Omnitrader strategy allows one to add a method to vote, in this case, ignore conflict. A stop order is also added making the strategy much more efficient. In the chart the Vote line triggered a buy based on the RSI 14-Period strategy. Looking at the chart, what is a negative is the candlestick hammer. This throws uncertainty into the buy signal given. Do note the Verve trailing stop confirming the Vote line buy signal given on November 8th, and the sell signal given on January 11th. So, with this uncertainty, analyzing the share further is a must. |
|
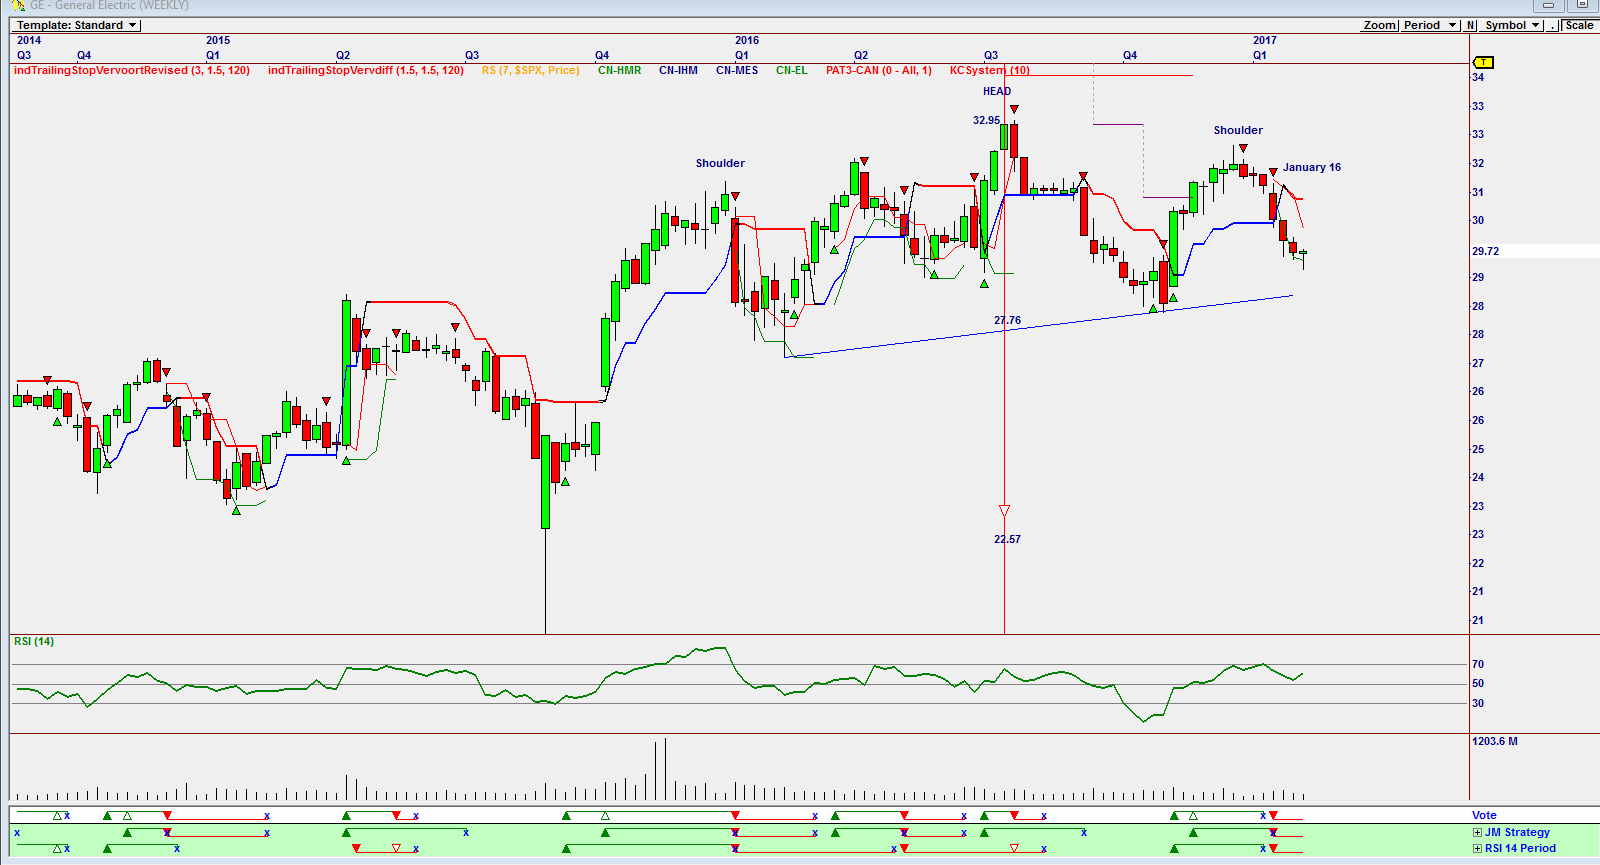
| Figure 2. Weekly chart for GE. |
| Graphic provided by: Omnitrader. |
| |
| So, let's look at the share on a weekly basis. A head-and-shoulders formation is shown. This suggests that the share price could drop to $22.57 (32.95 - 27.76 = 5.19. 27.76 - 5.19 = 22.57). With the Vote line confirming a sell signal given on January 16th and an RSI indicator trending down, buying the share could be risky. So, do you buy the share based on a signal given by a daily chart or do you look at both a daily and weekly chart for confirmation? Short term traders go with a daily chart. Long term investors, on the other hand, look at a daily, weekly and monthly chart before making their final decision. |
Has been a technical analyst since 1969, and has worked as a futures and options trader with First Financial Futures in Johannesburg, South Africa.
| Address: | 3256 West 24th Ave |
| Vancouver, BC | |
| Phone # for sales: | 6042634214 |
| E-mail address: | petroosp@gmail.com |
Click here for more information about our publications!
PRINT THIS ARTICLE

Request Information From Our Sponsors
- StockCharts.com, Inc.
- Candle Patterns
- Candlestick Charting Explained
- Intermarket Technical Analysis
- John Murphy on Chart Analysis
- John Murphy's Chart Pattern Recognition
- John Murphy's Market Message
- MurphyExplainsMarketAnalysis-Intermarket Analysis
- MurphyExplainsMarketAnalysis-Visual Analysis
- StockCharts.com
- Technical Analysis of the Financial Markets
- The Visual Investor
- VectorVest, Inc.
- Executive Premier Workshop
- One-Day Options Course
- OptionsPro
- Retirement Income Workshop
- Sure-Fire Trading Systems (VectorVest, Inc.)
- Trading as a Business Workshop
- VectorVest 7 EOD
- VectorVest 7 RealTime/IntraDay
- VectorVest AutoTester
- VectorVest Educational Services
- VectorVest OnLine
- VectorVest Options Analyzer
- VectorVest ProGraphics v6.0
- VectorVest ProTrader 7
- VectorVest RealTime Derby Tool
- VectorVest Simulator
- VectorVest Variator
- VectorVest Watchdog