

HOT TOPICS LIST
- MACD
- Fibonacci
- RSI
- Gann
- ADXR
- Stochastics
- Volume
- Triangles
- Futures
- Cycles
- Volatility
- ZIGZAG
- MESA
- Retracement
- Aroon
INDICATORS LIST
LIST OF TOPICS
PRINT THIS ARTICLE
by Koos van der Merwe
With the up/down movement in the stock market recently, finding a stock to buy and hold for the long term is not that easy.
Position: Buy
Koos van der Merwe
Has been a technical analyst since 1969, and has worked as a futures and options trader with First Financial Futures in Johannesburg, South Africa.
PRINT THIS ARTICLE
TECHNICAL ANALYSIS
Four Stocks To Look At
02/08/17 12:21:48 PMby Koos van der Merwe
With the up/down movement in the stock market recently, finding a stock to buy and hold for the long term is not that easy.
Position: Buy
| The Advanced GET chart of the Dow Jones Industrial Index is suggesting that a WAVE 5 top has been completed, and that the index should start falling in an ABC correction. This is confirmed by a daily chart of the S&P500 index. In both charts the RSI indicator gave sell signals on December 14th, when the Elliott wave was tracing a WAVE 4 correction. The Nasdaq 100 index however, suggested a WAVE 5 top on January 27, also with an RSI sell signal. But, uncertainty does exist. So, with that uncertainty hovering above your head, you could place your money in secure bonds, or look for stocks that offer a quick short-term gain. Below are four stocks that have caught my attention this past week. |
|
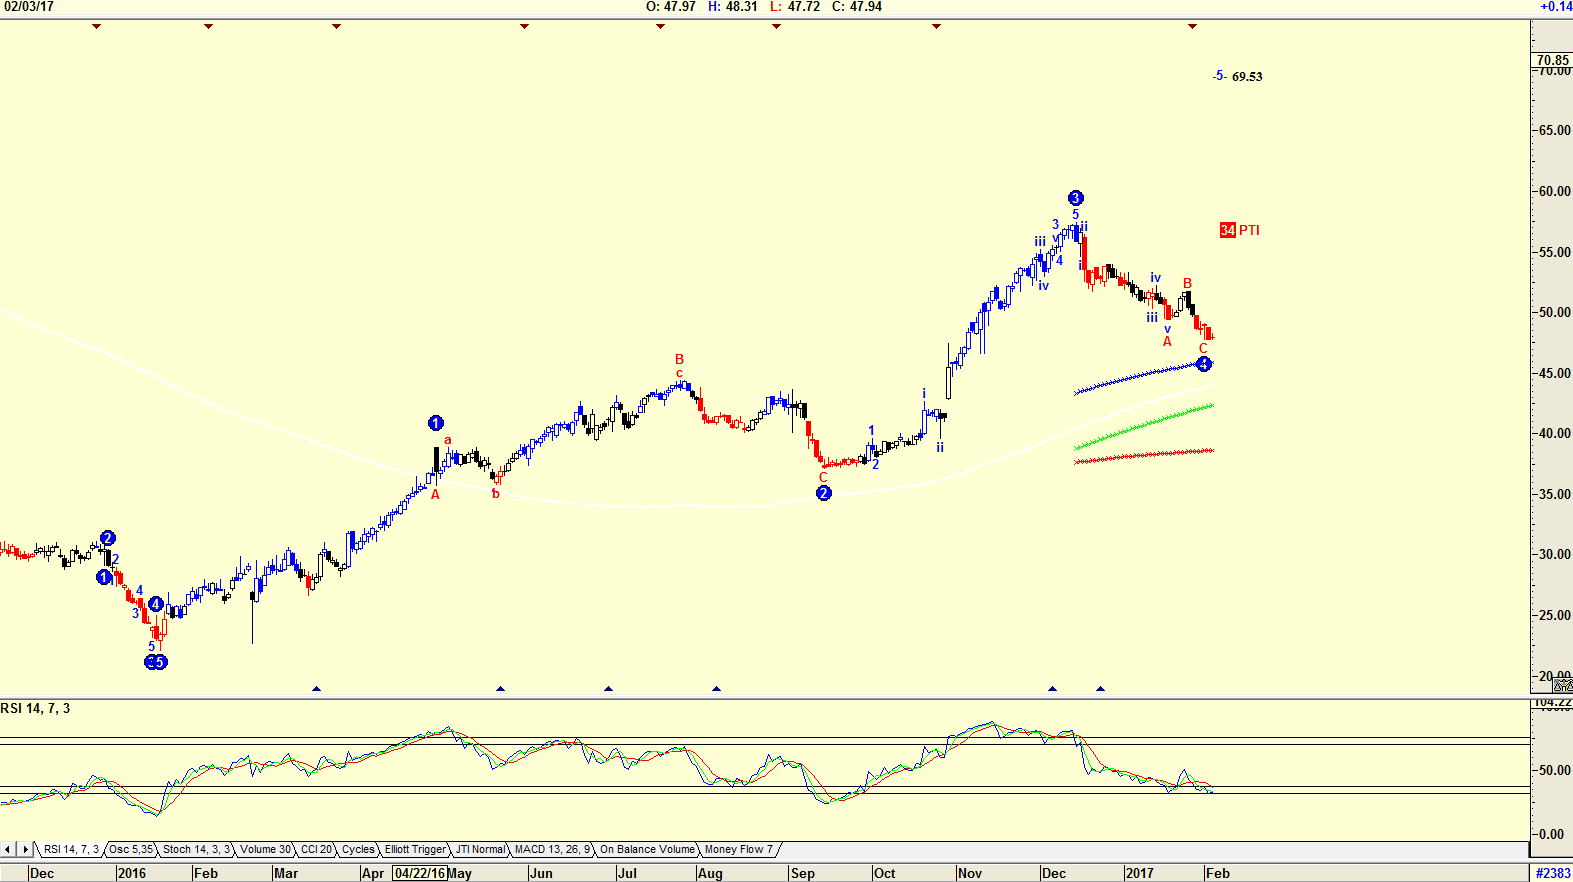
| Figure 1. Elliott wave count of Innophos Holdings. |
| Graphic provided by: AdvancedGET. |
| |
| The chart in Figure 1 is a chart of Innophos Holdings. The chart in Figure 1 suggests that the share is completing an Elliott WAVE 4 and should start rising in a WAVE 5 with a target of $69.53. The PTI (probability Index) is suggesting a 34% probability of this happening. The RSI Index is oversold suggesting a buy. Innophos is a leading producer of specialty grade phosphate products for the Food, Pharmaceutical and Industrial markets. |
|
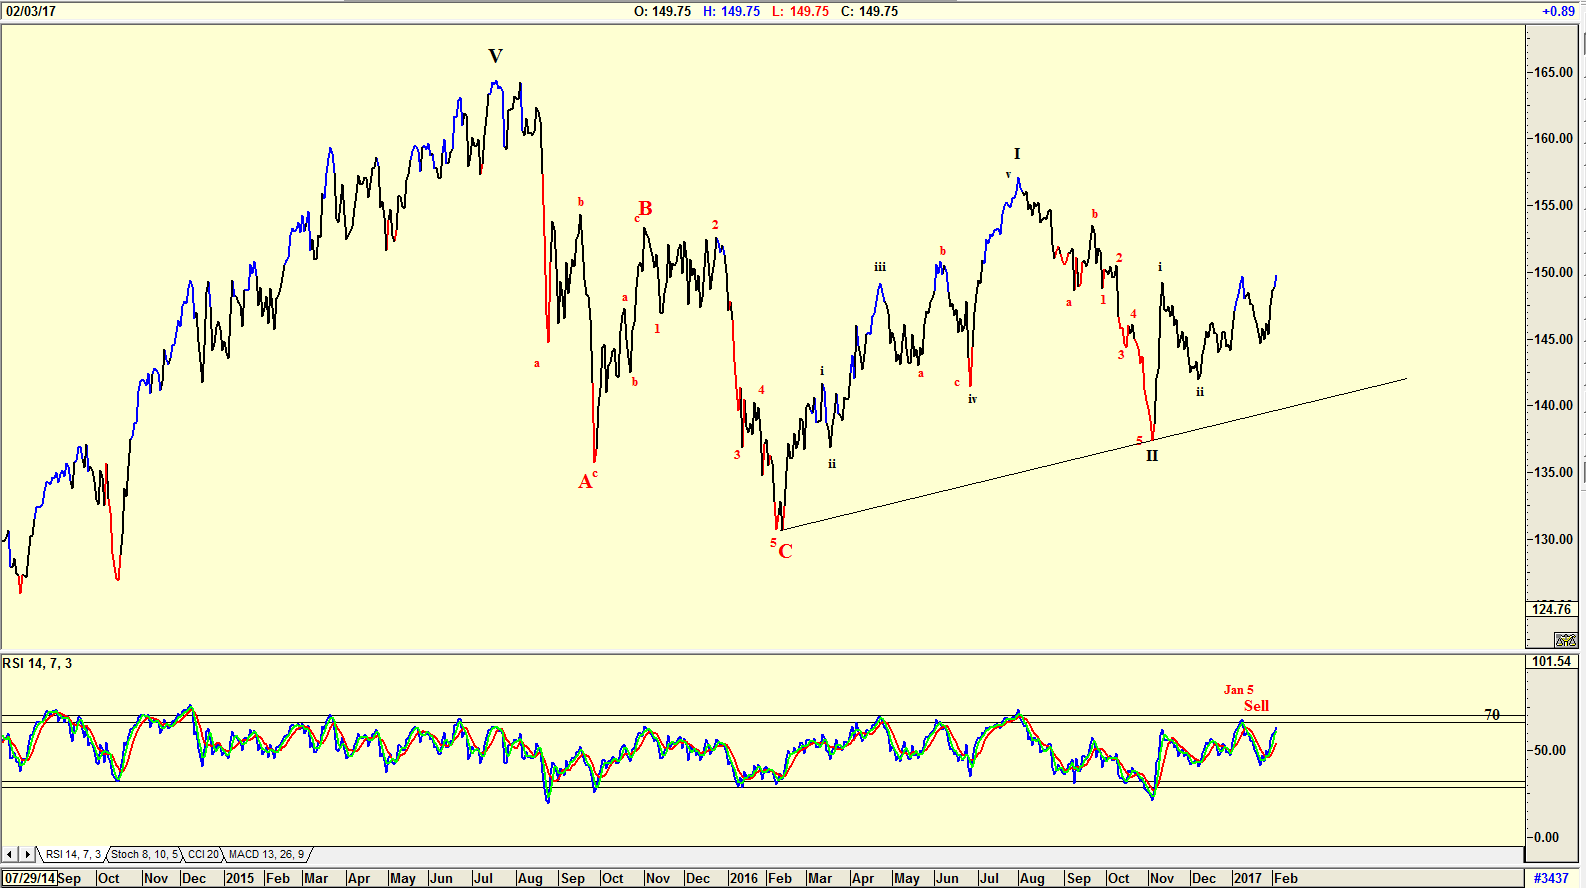
| Figure 2. Elliott wave count of US Healthcare Sector. |
| Graphic provided by: AdvancedGET. |
| |
| The chart in Figure 2 is a chart of iShares US Healthcare Sector. The chart suggests an Elliott wave count with the iShare moving into a WAVE III. The RSI indicator is suggesting further downside having given a sell signal on January 5th, but the index could rise to the 70 horizontal line before giving a second sell signal. |
|
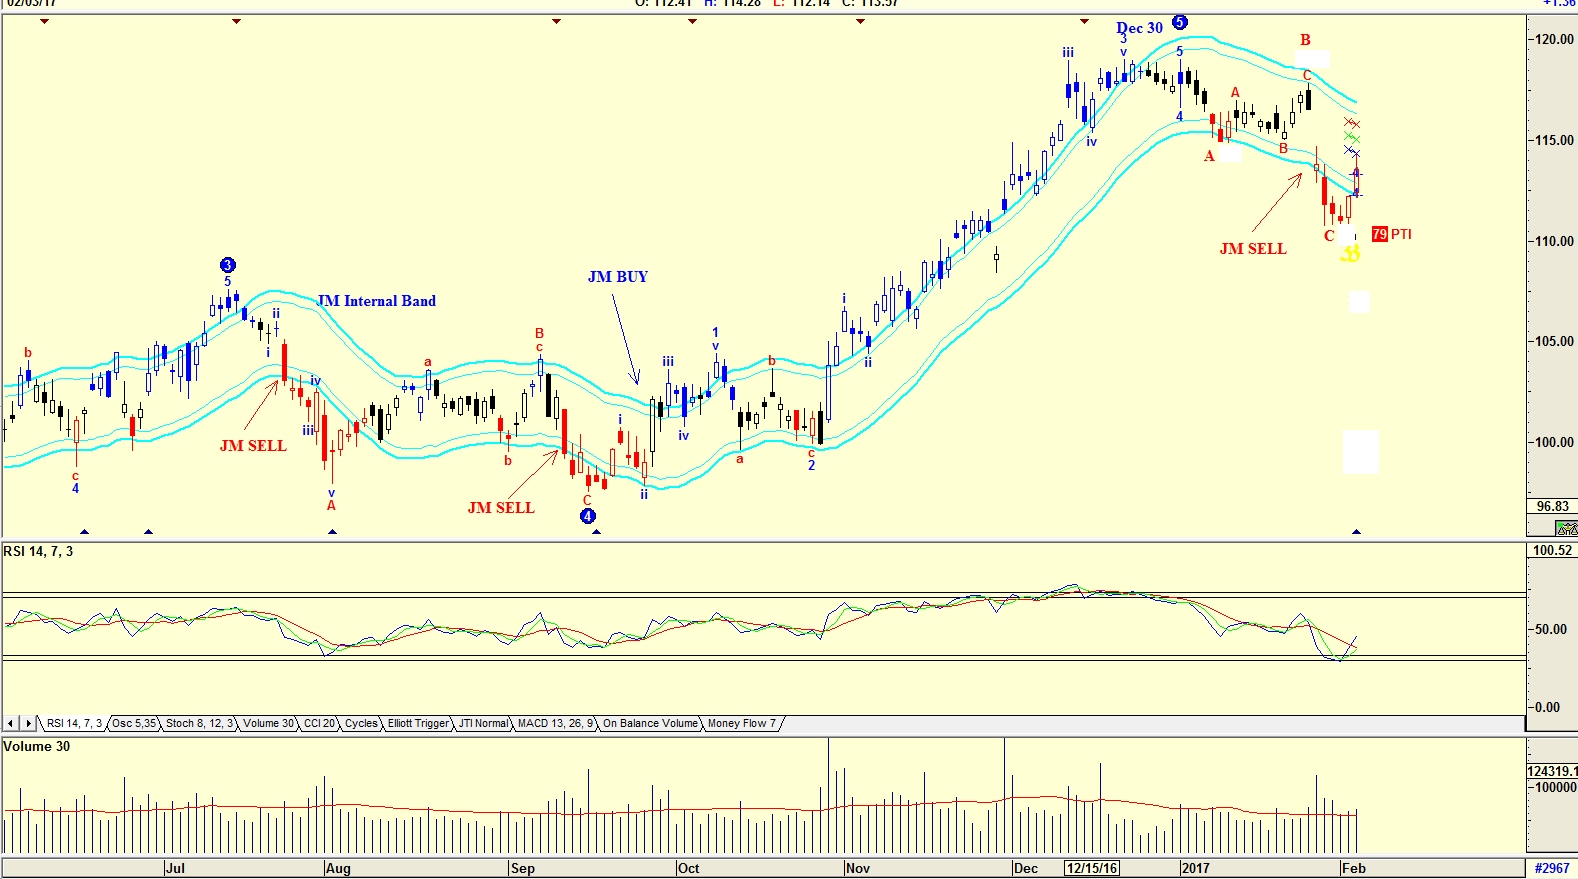
| Figure 3. Elliott Wave count and JM Internal Band of Chevron Texaco. |
| Graphic provided by: AdvancedGET. |
| |
| The chart in Figure 3 is a chart of Chevron Texaco. The chart shows an Elliott wave count with an ABC correction after a WAVE 5 top on December 30th. The RSI indicator is at oversold levels and trending up having given a buy. Volume as the share price rose has strengthened, suggesting a rise in the share price. The JM Internal Band is, however, still in sell mode. The JM Internal Band is a 15 period simple moving average offset by 2% positive and 2% negative. A rise above the upper band suggests strength, and below the lower band, weakness. |
|
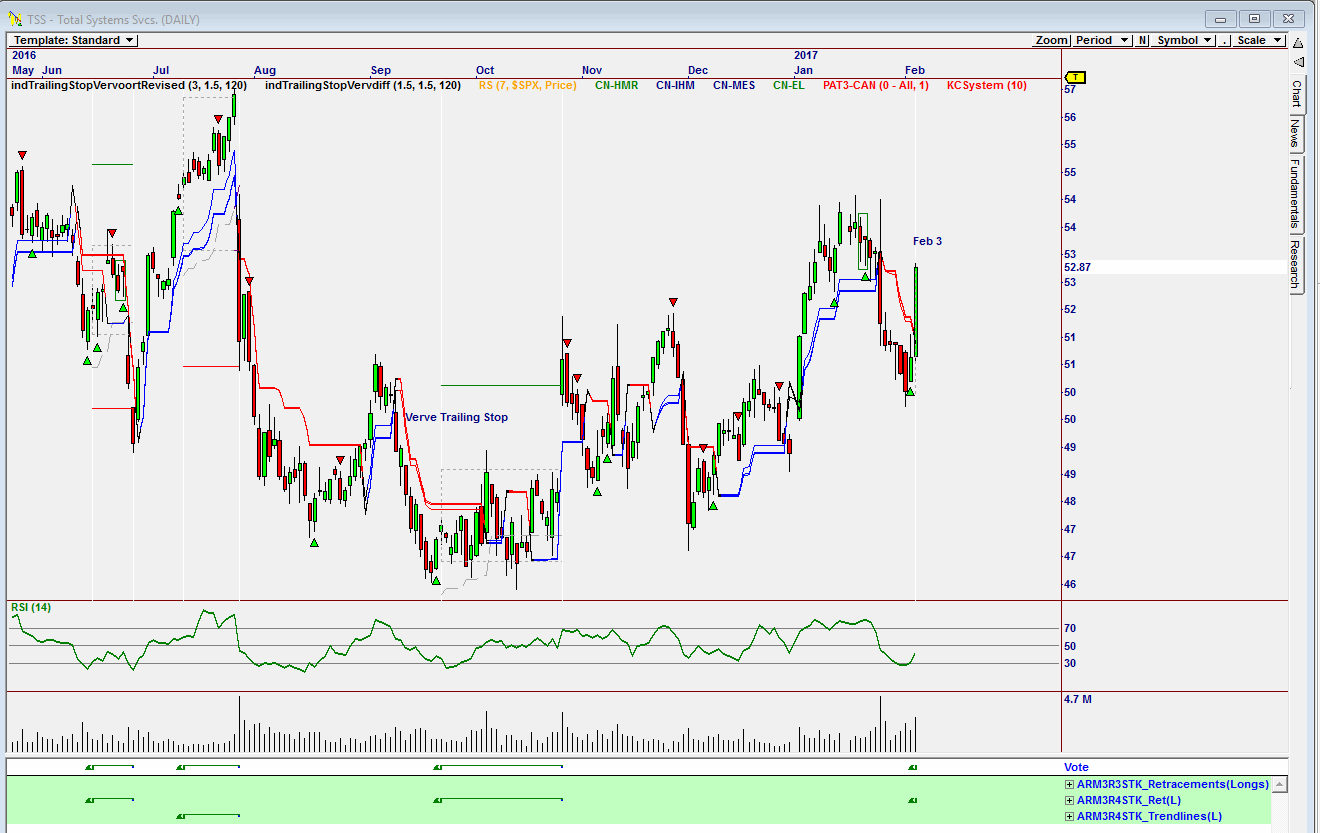
| Figure 4. Omnitrader Chart suggesting a buy on Total Systems Svcs. |
| Graphic provided by: Omnitrader. |
| |
| The chart in Figure 4 is an Omnitrader chart of TSS showing a buy signal by the ARM3R4STK strategy. This strategy is an Omnitrader strategy that comes with the program. The RSI indicator is oversold and has given a buy. As the share price rose, and strongly on February 3rd, volume also rose suggesting strength. Looking back in the chart, one can see that the buy signals given in the past have been very profitable. Note also that the price has risen above the Verve trailing stop. The shares listed above are four of many that have been triggered by the technical analysis programs I use to identify stocks to buy. In all my charts I do carefully watch the Verve trailing stop as shown in Figure 4 which is a stop loss indicator. Yes, with 3 down days this past week in the Dow, and 2 up days, buying shares could be risky, but tight stops and careful analysis of the share price is usually a winner. |
Has been a technical analyst since 1969, and has worked as a futures and options trader with First Financial Futures in Johannesburg, South Africa.
| Address: | 3256 West 24th Ave |
| Vancouver, BC | |
| Phone # for sales: | 6042634214 |
| E-mail address: | petroosp@gmail.com |
Click here for more information about our publications!
PRINT THIS ARTICLE

Request Information From Our Sponsors
- StockCharts.com, Inc.
- Candle Patterns
- Candlestick Charting Explained
- Intermarket Technical Analysis
- John Murphy on Chart Analysis
- John Murphy's Chart Pattern Recognition
- John Murphy's Market Message
- MurphyExplainsMarketAnalysis-Intermarket Analysis
- MurphyExplainsMarketAnalysis-Visual Analysis
- StockCharts.com
- Technical Analysis of the Financial Markets
- The Visual Investor
- VectorVest, Inc.
- Executive Premier Workshop
- One-Day Options Course
- OptionsPro
- Retirement Income Workshop
- Sure-Fire Trading Systems (VectorVest, Inc.)
- Trading as a Business Workshop
- VectorVest 7 EOD
- VectorVest 7 RealTime/IntraDay
- VectorVest AutoTester
- VectorVest Educational Services
- VectorVest OnLine
- VectorVest Options Analyzer
- VectorVest ProGraphics v6.0
- VectorVest ProTrader 7
- VectorVest RealTime Derby Tool
- VectorVest Simulator
- VectorVest Variator
- VectorVest Watchdog