HOT TOPICS LIST
- MACD
- Fibonacci
- RSI
- Gann
- ADXR
- Stochastics
- Volume
- Triangles
- Futures
- Cycles
- Volatility
- ZIGZAG
- MESA
- Retracement
- Aroon
INDICATORS LIST
LIST OF TOPICS
PRINT THIS ARTICLE
by Koos van der Merwe
In todays world does one invest in "alternative" stocks or ... ?
Position: Sell
Koos van der Merwe
Has been a technical analyst since 1969, and has worked as a futures and options trader with First Financial Futures in Johannesburg, South Africa.
PRINT THIS ARTICLE
ELLIOTT WAVE
Alternative...?
02/03/17 03:41:56 PMby Koos van der Merwe
In todays world does one invest in "alternative" stocks or ... ?
Position: Sell
| When one looks at the various indexes, the Dow, the S&P500 and the Nasdaq, the words used by Kellyanne Conway on January 22nd, 2017 come to mind. Conway introduced the term "alternative facts" when defending White House press secretary Sean Spicer after he asserted that President Trump's inauguration was the largest audience ever to witness an inauguration, both in person and around the globe. So, with President Trump in his first week of office signing numerous executive orders to fulfill a raft of pledges his campaign made about actions to take on "Day 1" as President, uncertainty in the stock market is starting to rear its ugly head. Sophisticated investors are starting to leave the market as the unsophisticated small investor pours money into the market. What do the indexes now tell us? |

|
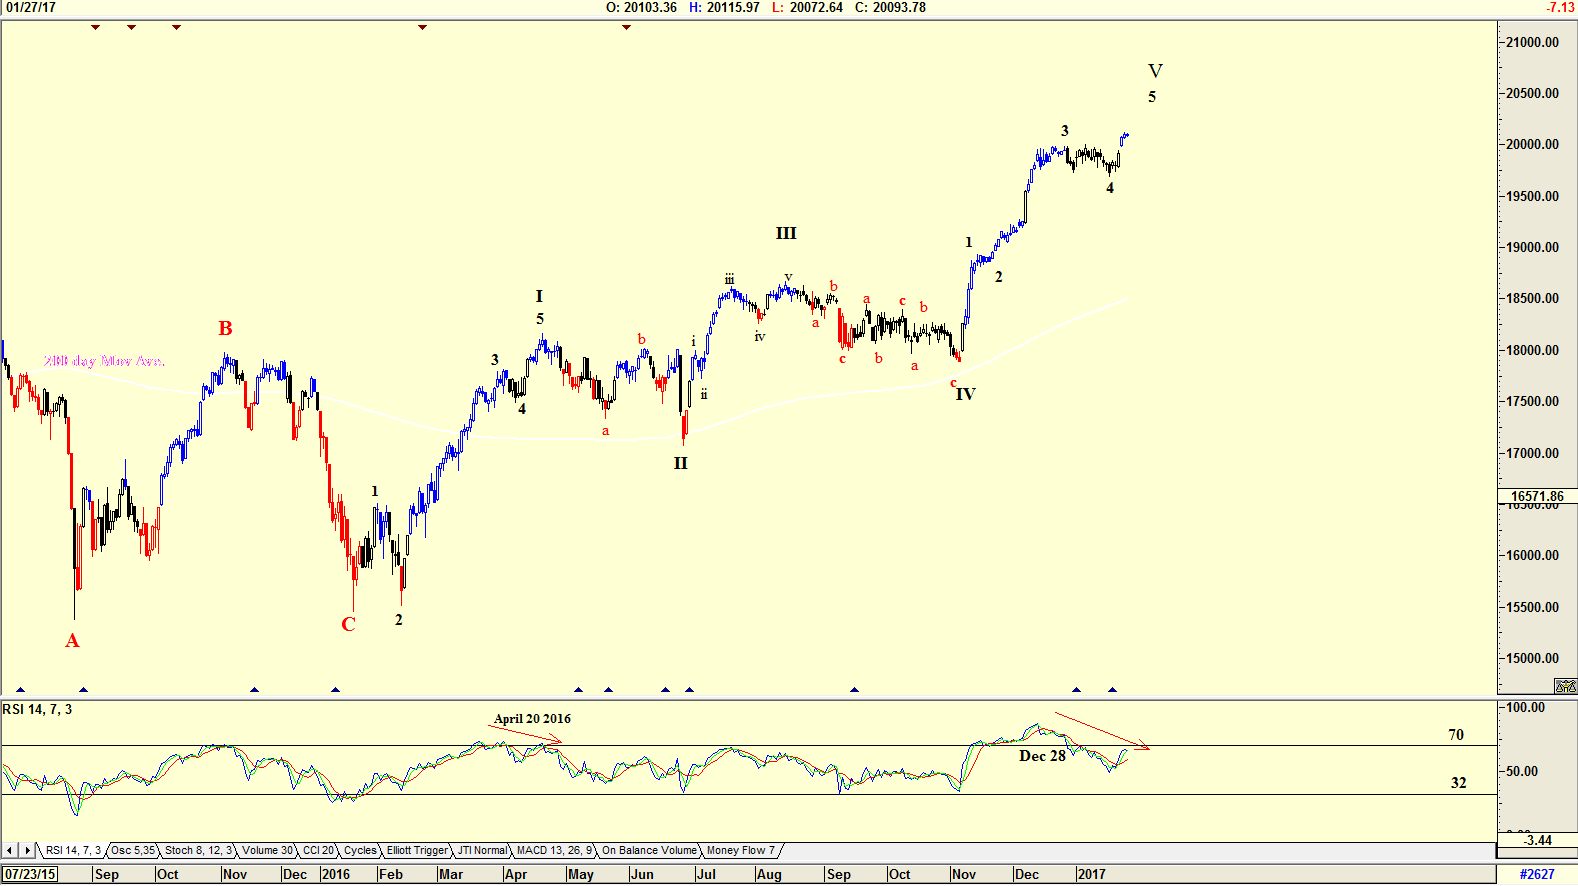
| Figure 1. Dow Jones with Elliott wave count. |
| Graphic provided by: AdvancedGET. |
| |
| The chart in Figure 1 is a daily chart of the Dow Jones with an Elliott wave count suggesting that the Dow is tracing an Elliott Wave V. The RSI indicator shown on the chart gave a sell signal on December 28th when it broke below the 70 horizontal line. Since then it has recovered as the Dow rose in a Wave 5 of WAVE V, however should it start turning down as forecast by the Elliott wave count, the index will give a strong sell based on the fact that the index has risen, but the RSI has fallen and will suggest a divergence sell with a lower top similar to the sell signal given April 20th, 2016. A divergence sell is suggested when the index makes a higher top, but the RSI makes a lower top. A divergence sell signal is a strong sell signal. |

|
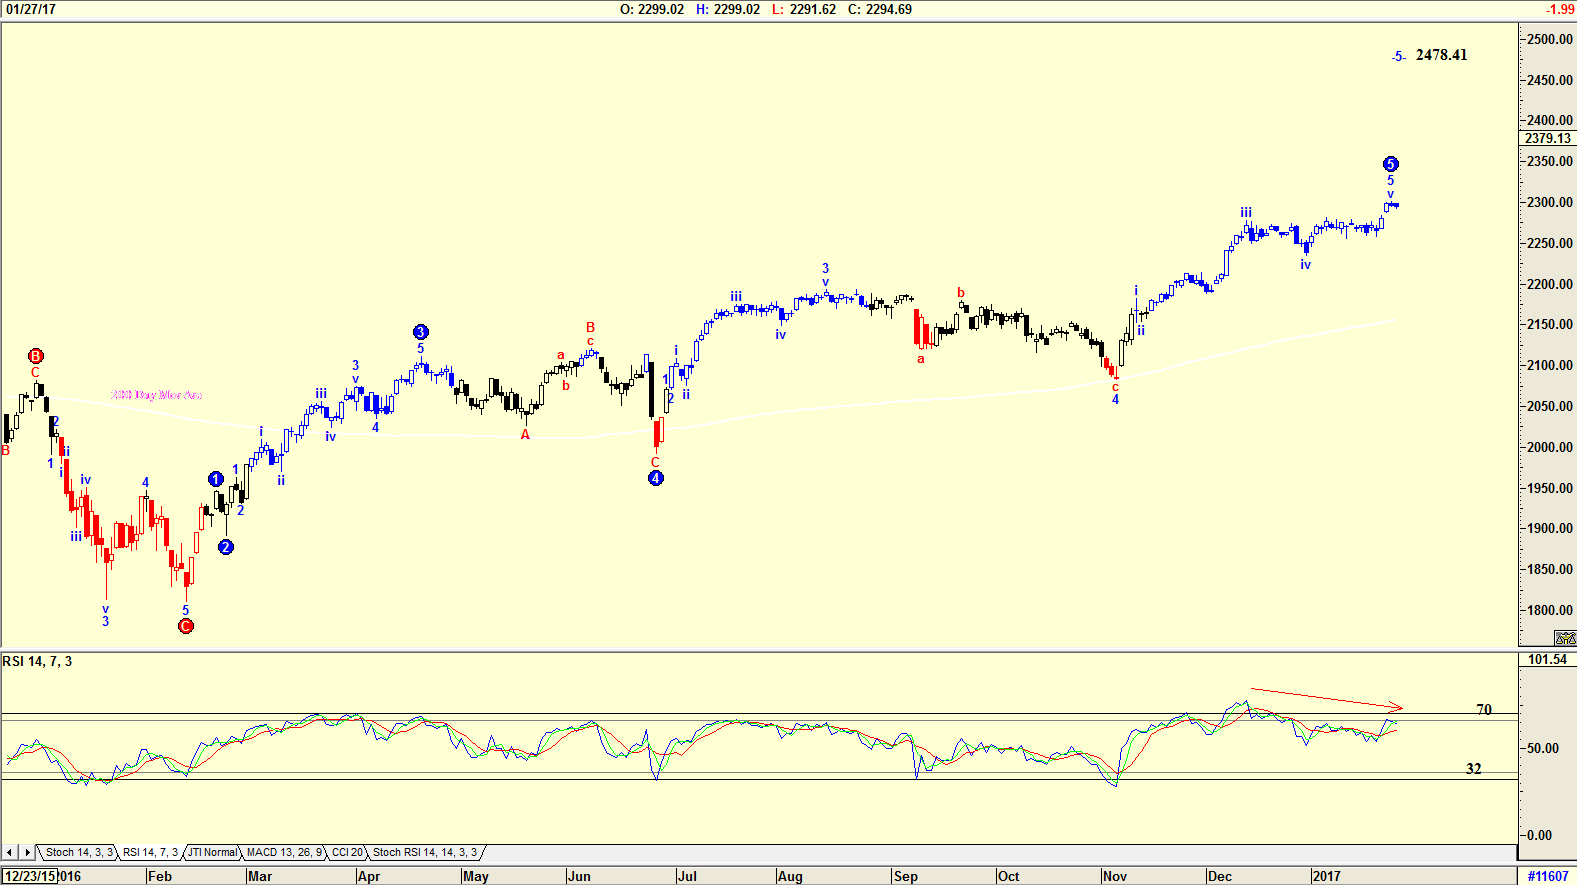
| Figure 2. Daily chart of the S&P 500 Index with Elliott wave count. |
| Graphic provided by: AdvancedGET. |
| |
| The chart in Figure 2 is a chart of the S&P 500 Index with an Elliott wave count suggesting that a WAVE 5 could top out at the present price or rise further to 2478.41. Once again, the RSI is suggesting a divergence sell signal. Do note how the indexes in both charts have fallen to, and bounced off, the 200-day moving average. |

|
| |
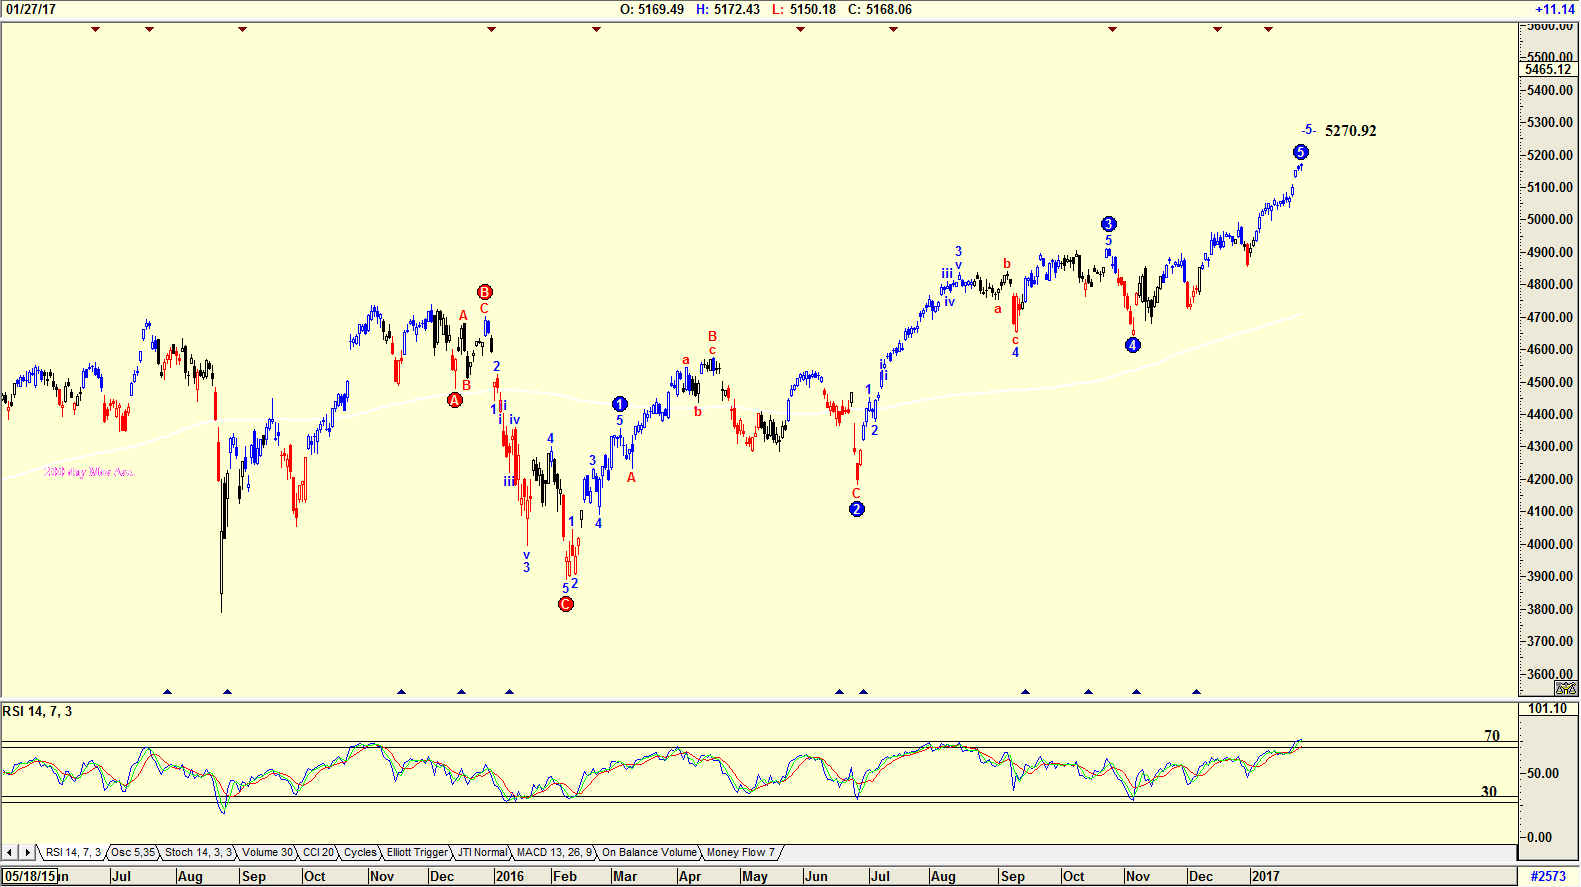
| The chart in Figure 3 is an Elliott wave chart of the Nasdaq 100 Index. Once again the Elliott wave is suggesting that the index is tracing a WAVE 5 with a target of 5270.92. The RSI indicator is at overbought levels, but unlike the charts in Figure 1 and 2, is not suggesting a divergence sell signal could occur. The index is still rising, suggesting that a sell could be sometime in the future. |

|
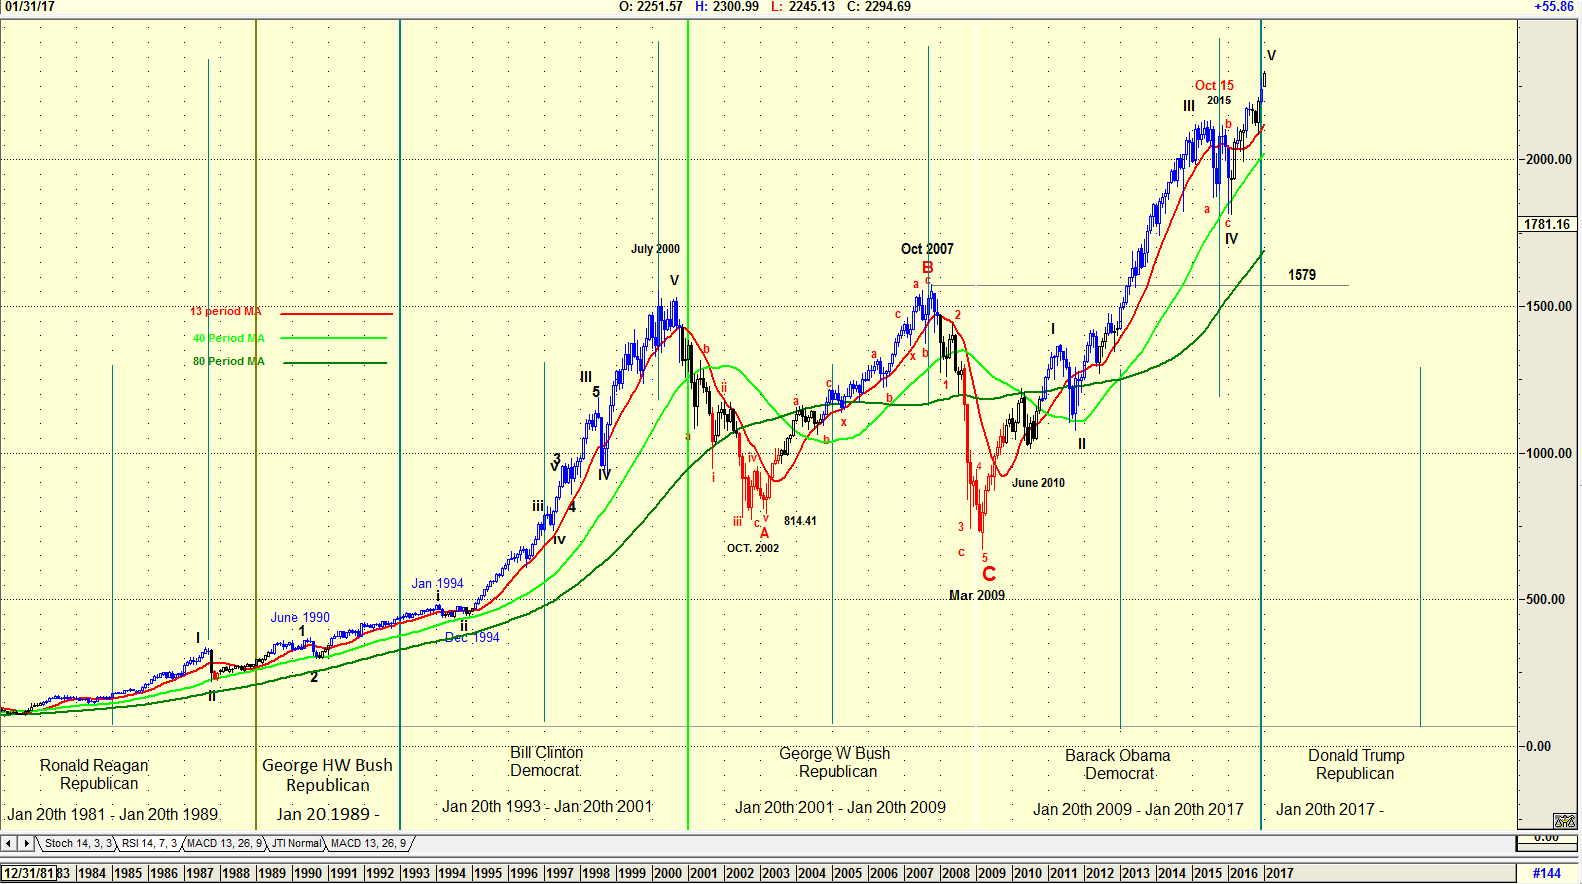
| Figure 4. Presidential cycle with monthly chart of the S&P 500 index. |
| Graphic provided by: AdvancedGET. |
| |
| The chart in Figure 4 is a monthly chart of the S&P 500 Index with the Presidential cycle. The chart is suggesting that a correction should occur. This is because the chart shows that with previous Presidents, the Index fell. With George HW Bush this occurred during the final years of Ronald Reagan. With Bill Clinton, a year after he was inaugurated as President and with George W Bush in his first two years as President and again in October 2007 before Barack Obama became President. The chart does show a 4th wave correction at the end of his term, but thne rose strongly into the inauguration of President Donald Trump. Will the Presidential cycle follow previous patterns and start falling in the first year of President Trump's Presidency? Time and an Elliott wave count suggests yes, but with "alternative facts" hitting the rounds, who knows what could happen. Uncertainty as to market direction exists as unsophisticated investors pour money into the market, supporting a Trump Presidency. However, with "alternative facts" dominant in the news, who knows what could happen. |
Has been a technical analyst since 1969, and has worked as a futures and options trader with First Financial Futures in Johannesburg, South Africa.
| Address: | 3256 West 24th Ave |
| Vancouver, BC | |
| Phone # for sales: | 6042634214 |
| E-mail address: | petroosp@gmail.com |
Click here for more information about our publications!
Comments
Date: 02/04/17Rank: 2Comment:

Request Information From Our Sponsors
- StockCharts.com, Inc.
- Candle Patterns
- Candlestick Charting Explained
- Intermarket Technical Analysis
- John Murphy on Chart Analysis
- John Murphy's Chart Pattern Recognition
- John Murphy's Market Message
- MurphyExplainsMarketAnalysis-Intermarket Analysis
- MurphyExplainsMarketAnalysis-Visual Analysis
- StockCharts.com
- Technical Analysis of the Financial Markets
- The Visual Investor
- VectorVest, Inc.
- Executive Premier Workshop
- One-Day Options Course
- OptionsPro
- Retirement Income Workshop
- Sure-Fire Trading Systems (VectorVest, Inc.)
- Trading as a Business Workshop
- VectorVest 7 EOD
- VectorVest 7 RealTime/IntraDay
- VectorVest AutoTester
- VectorVest Educational Services
- VectorVest OnLine
- VectorVest Options Analyzer
- VectorVest ProGraphics v6.0
- VectorVest ProTrader 7
- VectorVest RealTime Derby Tool
- VectorVest Simulator
- VectorVest Variator
- VectorVest Watchdog
