

HOT TOPICS LIST
- MACD
- Fibonacci
- RSI
- Gann
- ADXR
- Stochastics
- Volume
- Triangles
- Futures
- Cycles
- Volatility
- ZIGZAG
- MESA
- Retracement
- Aroon
INDICATORS LIST
LIST OF TOPICS
PRINT THIS ARTICLE
by Stella Osoba, CMT
One of the worst performing sectors this past year has been the Health Care sector, and of its sub-sectors, Biotechnology was one of the poorest performers. Gilead Sciences (GILD), a component of that sub-sector lost about 21% over the past year, making it one of the weakest performers year-to-date in its group. A quick glance at its chart shows it still in a steady down trend. But we all know that nothing lasts forever and S&P 500 companies likely will not fall to zero. So, are there any early shoots of positivity which suggest we might be wise to start giving GILD a closer look for a long play?
Position: N/A
Stella Osoba, CMT
Stella Osoba is a trader and financial writer. She is a frequent contributor to "Technical Analysis of Stocks and Commodities" magazine and "Traders.com Advantage" as well as other financial publications.
PRINT THIS ARTICLE
TECHNICAL INDICATORS
Gilead Sciences and the Ulcer Index
02/03/17 03:46:46 PMby Stella Osoba, CMT
One of the worst performing sectors this past year has been the Health Care sector, and of its sub-sectors, Biotechnology was one of the poorest performers. Gilead Sciences (GILD), a component of that sub-sector lost about 21% over the past year, making it one of the weakest performers year-to-date in its group. A quick glance at its chart shows it still in a steady down trend. But we all know that nothing lasts forever and S&P 500 companies likely will not fall to zero. So, are there any early shoots of positivity which suggest we might be wise to start giving GILD a closer look for a long play?
Position: N/A
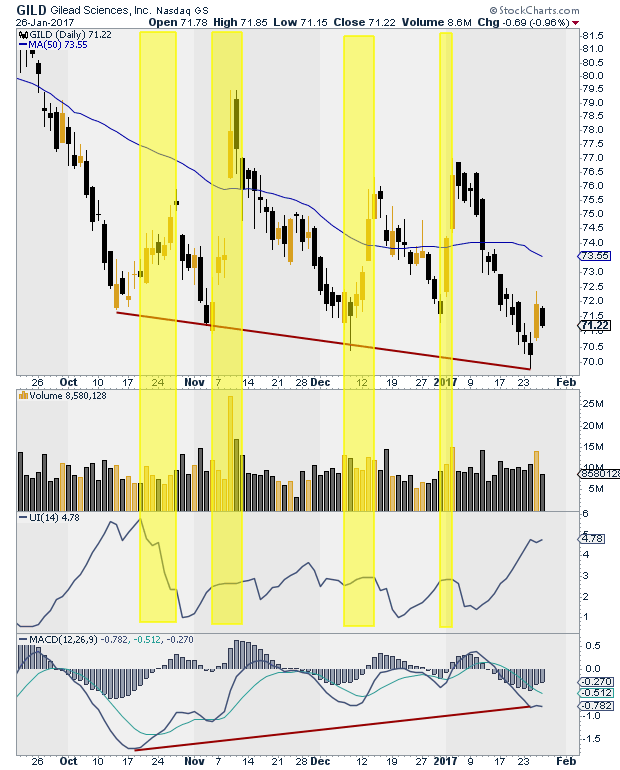
| The Ulcer Index is produced in the panel below volume. This index is a volatility index originally intended for mutual funds because it only measures downside risk. Mutual funds are long only, so they are concerned with drawdown risk. The Ulcer Index was developed in 1987 by Byron McCann and Peter Martin. When the index is zero it means that prices closed higher in each of the previous n periods. The default setting which is used here is 14 days. The Ulcer Index might work better with longer time periods such as weekly data, but here we are using daily data. |
| Areas highlighted yellow on the chart below show periods when the Ulcer Index is falling, these roughly coincide with periods when price is rising. When prices are falling, the index rises. The latest reading on the chart shows the Ulcer Index rising as prices continue to fall and register new lows. |
|
| Figure 1. Daily chart for GILD with the Ulcer Index. |
| Graphic provided by: StockCharts.com. |
| |
| However, the news might not be all bad. In the lowest panel below the price chart is the MACD which is showing positive divergence; price makes lower lows, but the MACD does not. The MACD is currently making higher lows. Now bear in mind that divergences, positive or negative, can fail. Divergences simply reflect a slowing or speeding up of momentum which is out of sync with price. Price decline can slow, speed up and slow again, all the while registering lower lows or higher lows. But it is useful to pay attention to price action in light of the length of the current bear trend. Remember as stated above, that nothing lasts forever, not even a vicious bear trend. |
| Since there is no telling from current price action when a reversal might happen and noting that one could be months in the making giving price time to form a proper base, patience and discipline are essential. But be vigilant and pay attention, because when the reversal eventually comes, you want to spot it early and get on board. |
Stella Osoba is a trader and financial writer. She is a frequent contributor to "Technical Analysis of Stocks and Commodities" magazine and "Traders.com Advantage" as well as other financial publications.
| E-mail address: | stellaosoba@gmail.com |
Click here for more information about our publications!
PRINT THIS ARTICLE

Request Information From Our Sponsors
- StockCharts.com, Inc.
- Candle Patterns
- Candlestick Charting Explained
- Intermarket Technical Analysis
- John Murphy on Chart Analysis
- John Murphy's Chart Pattern Recognition
- John Murphy's Market Message
- MurphyExplainsMarketAnalysis-Intermarket Analysis
- MurphyExplainsMarketAnalysis-Visual Analysis
- StockCharts.com
- Technical Analysis of the Financial Markets
- The Visual Investor
- VectorVest, Inc.
- Executive Premier Workshop
- One-Day Options Course
- OptionsPro
- Retirement Income Workshop
- Sure-Fire Trading Systems (VectorVest, Inc.)
- Trading as a Business Workshop
- VectorVest 7 EOD
- VectorVest 7 RealTime/IntraDay
- VectorVest AutoTester
- VectorVest Educational Services
- VectorVest OnLine
- VectorVest Options Analyzer
- VectorVest ProGraphics v6.0
- VectorVest ProTrader 7
- VectorVest RealTime Derby Tool
- VectorVest Simulator
- VectorVest Variator
- VectorVest Watchdog