HOT TOPICS LIST
- MACD
- Fibonacci
- RSI
- Gann
- ADXR
- Stochastics
- Volume
- Triangles
- Futures
- Cycles
- Volatility
- ZIGZAG
- MESA
- Retracement
- Aroon
INDICATORS LIST
LIST OF TOPICS
PRINT THIS ARTICLE
by Stella Osoba, CMT
It is tempting to look at the price of a stock and think that if it is cheap, then it is a bargain. This is a trap novice investors often fall into because it is easy to confuse price with value.
Position: N/A
Stella Osoba, CMT
Stella Osoba is a trader and financial writer. She is a frequent contributor to "Technical Analysis of Stocks and Commodities" magazine and "Traders.com Advantage" as well as other financial publications.
PRINT THIS ARTICLE
AVE DIREC MOVE
Bottom Fishing
02/10/17 03:01:03 PMby Stella Osoba, CMT
It is tempting to look at the price of a stock and think that if it is cheap, then it is a bargain. This is a trap novice investors often fall into because it is easy to confuse price with value.
Position: N/A
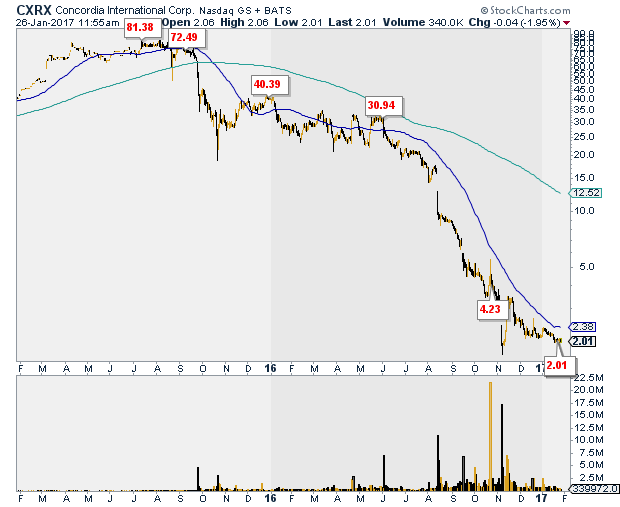
| Figure 1 shows the price action for Concordia International Corp. (CXRX) which has been in a steep decline for over a year. It fell from a high of $81.38 and is currently trading at a low of $2.01. To bargain seekers, this might seem like an attractive price to acquire bucket loads of cheap stock. The rationale might be something like; if I get a thousand shares at $2 per share and it goes up to $80 or even $40, I will clean up. But this kind of superficial approach to trading can be extremely dangerous. Often very cheap stocks are very risky stocks. Just because a stock's price is low, does not mean it cannot go lower. So where cheap stocks are concerned, it pays to be extra careful with your analysis. |

|
| Figure 1. Daily chart for CXRX (2015-2017). |
| Graphic provided by: TradeStation. |
| |
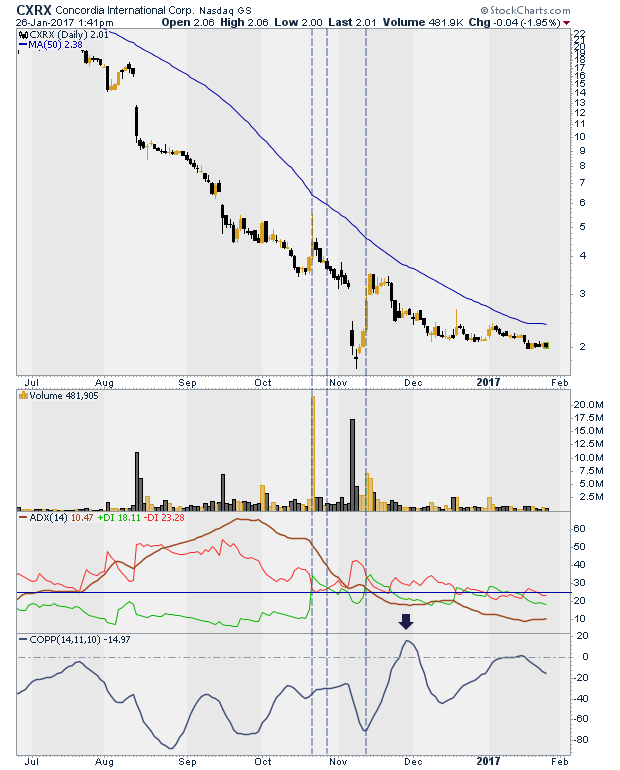
| Figure 2 shows current price action in more detail. |

|
| Figure 2. Daily chart of CXRX with ADX and Coppock Curve indicators. |
| Graphic provided by: StockCharts.com. |
| |
| A glance at the chart shows that after price reached a low in early November, it began to trade sideways. The 50-day moving average has begun to flatten out and price is not making any new lows. So, is now a good time to enter a long trade? I would say it is premature for the following reasons: 1. The stock is currently below its 50-day moving average and trading on extremely low volume. 2. The Average Directional Index (ADX), which is in the first panel below price, is below 25, which is bearish. According to Welles Wilder who developed the ADX, a strong trend is present when the indicator is above 25. When the ADX is below 20, no trend is present. Here the ADX is barely rising above 10. |
| The +DI and -DI complement the ADX by signaling trend direction. When the +DI crosses above the -DI it produces a buy signal. When the -DI crosses above the +DI it produces a sell signal. There are three signals marked on the chart by the vertical dashed lines. These signals were very weak and should not have been taken because price action was still decisively bearish. The first signal was a buy because the +DI crossed above the -DI. The second was a sell and the third was a buy. It is important when using technical analysis to be able to differentiate weak signals from strong ones. The Coppock Curve, which is in the second panel below price, is below zero which is negative. This indicator produces buying signals when the line rises above zero into positive territory. |
| Even though it is tempting to try and catch a bottom and scoop up cheap shares, anticipating price action can be a costly strategy. Strong buy signals should be taken when they appear, but until then it is best to hold your horses. |
Stella Osoba is a trader and financial writer. She is a frequent contributor to "Technical Analysis of Stocks and Commodities" magazine and "Traders.com Advantage" as well as other financial publications.
| E-mail address: | stellaosoba@gmail.com |
Click here for more information about our publications!
Comments
Date: 02/15/17Rank: 5Comment:

Request Information From Our Sponsors
- StockCharts.com, Inc.
- Candle Patterns
- Candlestick Charting Explained
- Intermarket Technical Analysis
- John Murphy on Chart Analysis
- John Murphy's Chart Pattern Recognition
- John Murphy's Market Message
- MurphyExplainsMarketAnalysis-Intermarket Analysis
- MurphyExplainsMarketAnalysis-Visual Analysis
- StockCharts.com
- Technical Analysis of the Financial Markets
- The Visual Investor
- VectorVest, Inc.
- Executive Premier Workshop
- One-Day Options Course
- OptionsPro
- Retirement Income Workshop
- Sure-Fire Trading Systems (VectorVest, Inc.)
- Trading as a Business Workshop
- VectorVest 7 EOD
- VectorVest 7 RealTime/IntraDay
- VectorVest AutoTester
- VectorVest Educational Services
- VectorVest OnLine
- VectorVest Options Analyzer
- VectorVest ProGraphics v6.0
- VectorVest ProTrader 7
- VectorVest RealTime Derby Tool
- VectorVest Simulator
- VectorVest Variator
- VectorVest Watchdog
