

HOT TOPICS LIST
- MACD
- Fibonacci
- RSI
- Gann
- ADXR
- Stochastics
- Volume
- Triangles
- Futures
- Cycles
- Volatility
- ZIGZAG
- MESA
- Retracement
- Aroon
INDICATORS LIST
LIST OF TOPICS
PRINT THIS ARTICLE
by Stella Osoba, CMT
As traders, we want to find signals for fast, profitable entries and exits, but sometimes it pays to take your time to enter a trade correctly, even when doing so means being subjected to a series of whiplash trades. The eventual pay off might make it worth the pain.
Position: N/A
Stella Osoba, CMT
Stella Osoba is a trader and financial writer. She is a frequent contributor to "Technical Analysis of Stocks and Commodities" magazine and "Traders.com Advantage" as well as other financial publications.
PRINT THIS ARTICLE
TECHNICAL INDICATORS
Working with the Coppock Curve
02/08/17 11:58:45 AMby Stella Osoba, CMT
As traders, we want to find signals for fast, profitable entries and exits, but sometimes it pays to take your time to enter a trade correctly, even when doing so means being subjected to a series of whiplash trades. The eventual pay off might make it worth the pain.
Position: N/A
| The Coppock Curve was developed by Edwin Coppock, who was trained as an economist. Coppock designed this momentum indicator using monthly data, with the intent of finding long term buying opportunities. But the indicator can be used with any time frame. Here we will use it will daily price data. |
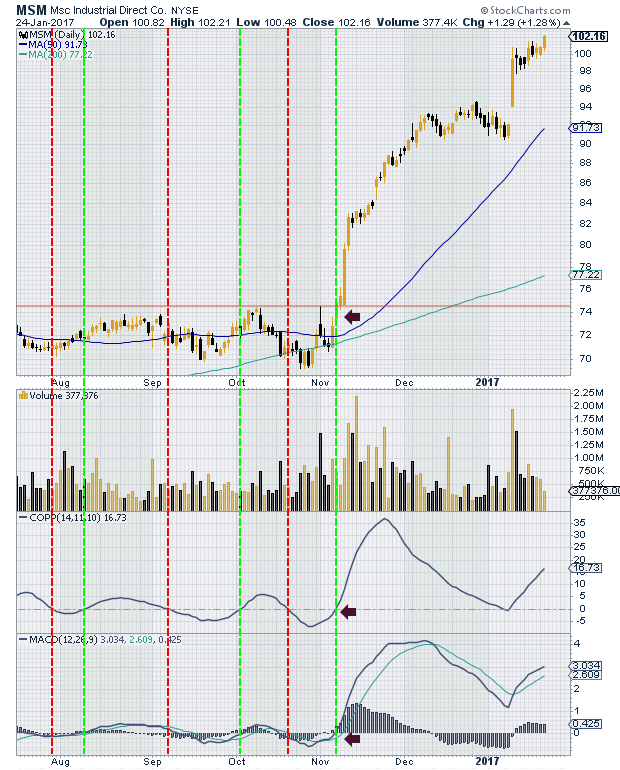
| The chart of Msc Industrial Direct Co. (MSM), reproduced below, will help illustrate how this indicator can remove some of the guess work from entering and staying in a position. Coppock designed the indicator to produce buying signals. Even though some traders use it to also produce shorting signals, in this instance we shall concentrate on long entries and exits. |
|
| Figure 1. Daily chart of MSM with Coppock Curve indicator. |
| Graphic provided by: StockCharts.com. |
| |
| The Coppock Curve is very easy to interpret. When the line crosses above the zero centerline, into positive territory, a buying signal is produced. Likewise, a sell signal would be produced when the line crosses back into negative territory or below the zero line. With these points in mind let us analyze the chart of MSM. |
| The red dashed lines show times when the Coppock Curve has crossed into negative territory. The green dashed line shows instances when the Coppock Curve has crossed into positive territory. To initiate a long position in MSM, ignoring all other signals and using only the Coppock Curve, would have had us take a long position in August when the curve crossed above its zero line. We would have exited the position for a small loss in September. The second signal was produced in October, again we would have exited for a small loss later that month. The third signal was produced in November and would have kept us in the position for the bull run which is not yet completed. We would have gone long at 74 and stayed in the position for the ensuing run up which is currently at 102. As the Coppock Curve has not yet produced a negative exit signal, we would still be holding the position. This would have more than made up for the preceding whiplash trades. |
| As we can see, the Coppock Curve correctly called the breakout, indicated by the horizontal line on the chart. To prevent the earlier whiplash trades use it with another indicator like the MACD and wait for breakouts on decisive volume. |
Stella Osoba is a trader and financial writer. She is a frequent contributor to "Technical Analysis of Stocks and Commodities" magazine and "Traders.com Advantage" as well as other financial publications.
| E-mail address: | stellaosoba@gmail.com |
Click here for more information about our publications!
PRINT THIS ARTICLE

Request Information From Our Sponsors
- StockCharts.com, Inc.
- Candle Patterns
- Candlestick Charting Explained
- Intermarket Technical Analysis
- John Murphy on Chart Analysis
- John Murphy's Chart Pattern Recognition
- John Murphy's Market Message
- MurphyExplainsMarketAnalysis-Intermarket Analysis
- MurphyExplainsMarketAnalysis-Visual Analysis
- StockCharts.com
- Technical Analysis of the Financial Markets
- The Visual Investor
- VectorVest, Inc.
- Executive Premier Workshop
- One-Day Options Course
- OptionsPro
- Retirement Income Workshop
- Sure-Fire Trading Systems (VectorVest, Inc.)
- Trading as a Business Workshop
- VectorVest 7 EOD
- VectorVest 7 RealTime/IntraDay
- VectorVest AutoTester
- VectorVest Educational Services
- VectorVest OnLine
- VectorVest Options Analyzer
- VectorVest ProGraphics v6.0
- VectorVest ProTrader 7
- VectorVest RealTime Derby Tool
- VectorVest Simulator
- VectorVest Variator
- VectorVest Watchdog