HOT TOPICS LIST
- MACD
- Fibonacci
- RSI
- Gann
- ADXR
- Stochastics
- Volume
- Triangles
- Futures
- Cycles
- Volatility
- ZIGZAG
- MESA
- Retracement
- Aroon
INDICATORS LIST
LIST OF TOPICS
PRINT THIS ARTICLE
by Koos van der Merwe
On Friday, when her husband Donald Trump was sworn in as the 45th President of the United States, Melania Trump wore a dress designed by Ralph Lauren.
Position: Accumulate
Koos van der Merwe
Has been a technical analyst since 1969, and has worked as a futures and options trader with First Financial Futures in Johannesburg, South Africa.
PRINT THIS ARTICLE
TECHNICAL ANALYSIS
Ralph Lauren
01/25/17 04:19:40 PMby Koos van der Merwe
On Friday, when her husband Donald Trump was sworn in as the 45th President of the United States, Melania Trump wore a dress designed by Ralph Lauren.
Position: Accumulate
| Ralph Lauren built his empire on selling the myth of the American dream. The outfit Mrs. Trump wore since the inaugural festivities began is the third outfit by a New York designer, connecting her to the American fashion establishment. Hillary Clinton also wore a Ralph Lauren suit to the swearing-in. So, is it now time to buy Ralph Lauren shares? Are Melania Trump and Hillary Clinton telling us that this is the way to go? |

|
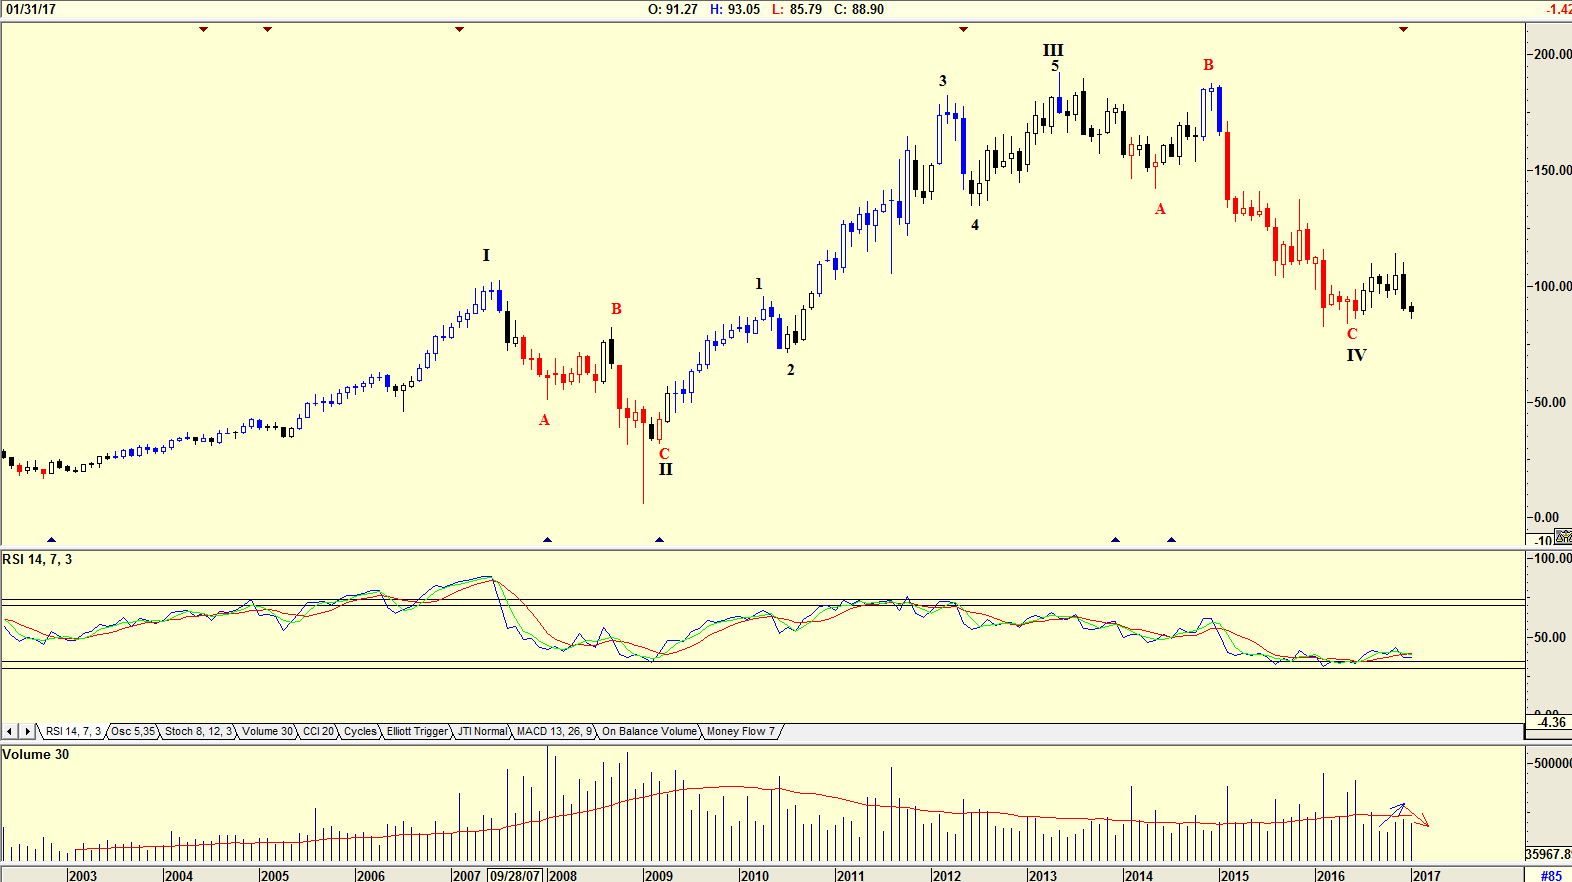
| Figure 1. Monthly chart of Ralph Lauren with an Elliott Wave count. |
| Graphic provided by: AdvancedGET. |
| |
| The chart in Figure 1 is a monthly chart with an Elliott wave count suggesting that the share price could be in a WAVE IV correction. The RSI indicator is at oversold levels suggesting that the share price could start rising in a WAVE V. Volume fell as the share price fell, suggesting strength. |

|
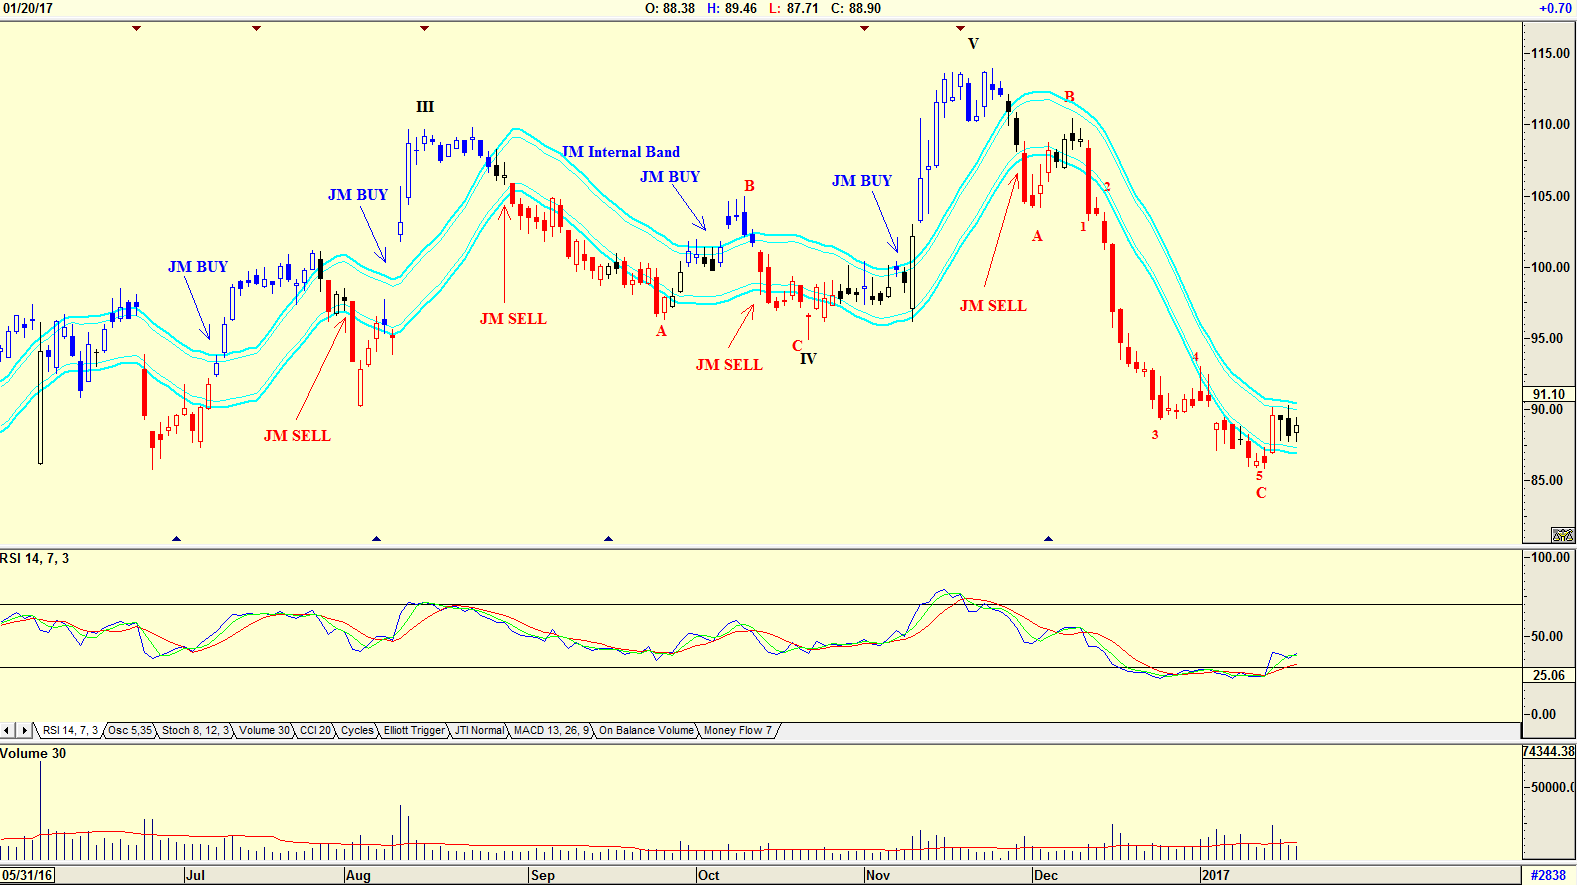
| Figure 2. Daily Chart of Ralph Lauren with JM Internal Band. |
| Graphic provided by: AdvancedGET. |
| |
| The chart in Figure 2 is a daily chart with a JM Internal Band and an RSI indicator. The JM Internal band is a 15 period simple moving average offset by 2% plus and 2% negative. A move above the upper band suggests a buy and below the lower band a sell as shown on the chart. The share price has not yet given a JM Buy, but it appears to be testing the upper band. The RSI indicator however is at oversold levels, and is suggesting a buy. The daily Elliott wave count is suggesting the start of a WAVE 1 after the correction. |

|
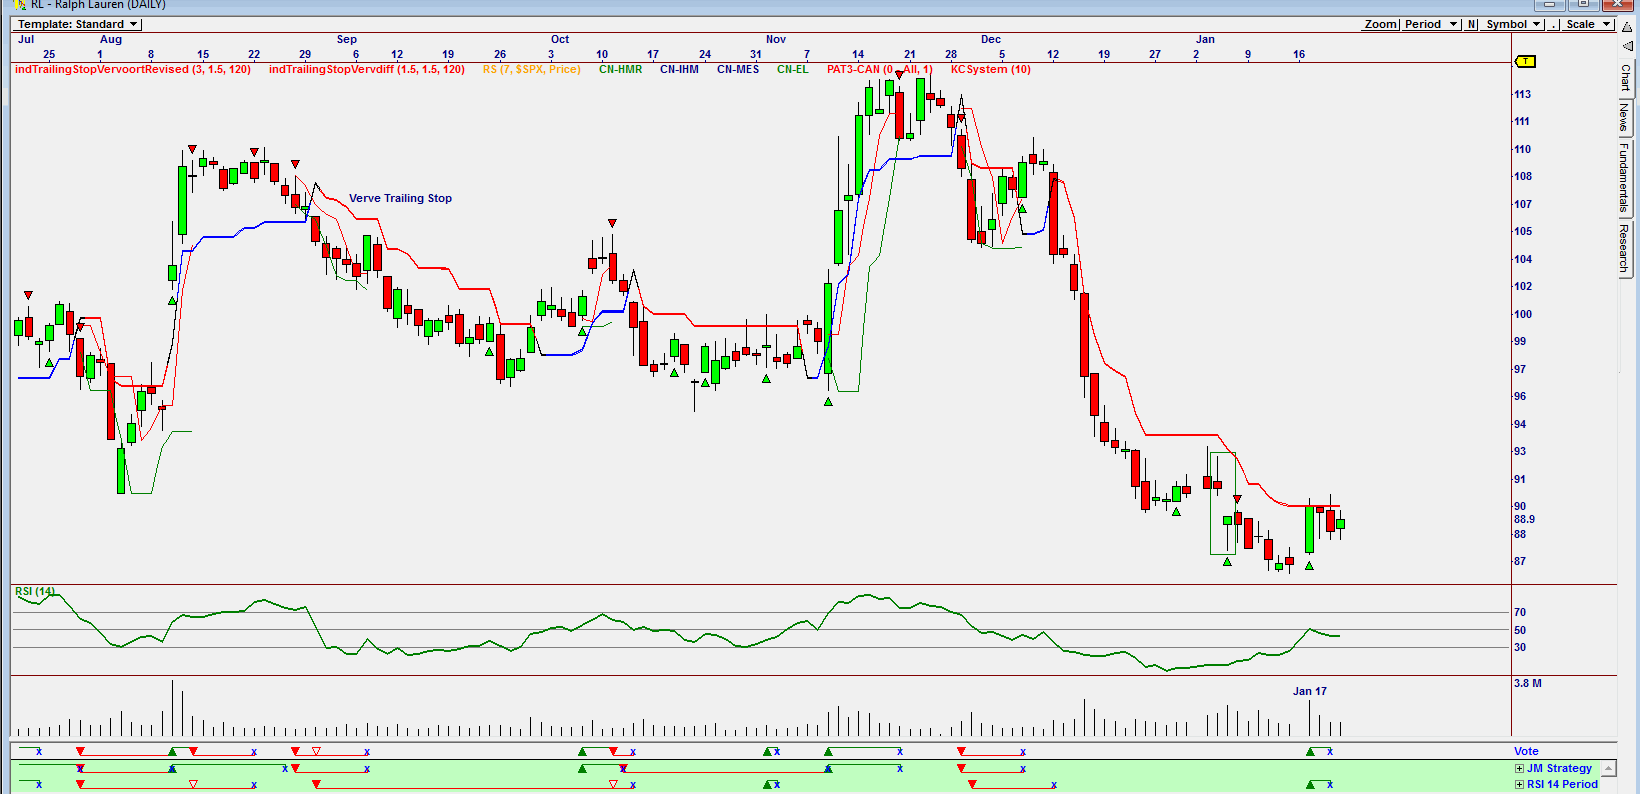
| Figure 3. Omnitrader chart showing buy and sell signals. |
| Graphic provided by: Omnitrader.. |
| |
| The chart in Figure 3 is an Omnitrader chart which suggested a buy on January 17th, followed by a stop two days later. The share price tested the Verve trailing stop, but never broke above it. The chart also shows that volume dropped as the share price dropped — a sign of strength. I would be a slow buyer of Ralph Lauren shares, buying them on any correction and holding for the very long term. With President Donald Trump advising his wife and America to "follow two simple rules: Buy American and Hire American." |
Has been a technical analyst since 1969, and has worked as a futures and options trader with First Financial Futures in Johannesburg, South Africa.
| Address: | 3256 West 24th Ave |
| Vancouver, BC | |
| Phone # for sales: | 6042634214 |
| E-mail address: | petroosp@gmail.com |
Click here for more information about our publications!
Comments
Date: 02/06/17Rank: 1Comment:

Request Information From Our Sponsors
- VectorVest, Inc.
- Executive Premier Workshop
- One-Day Options Course
- OptionsPro
- Retirement Income Workshop
- Sure-Fire Trading Systems (VectorVest, Inc.)
- Trading as a Business Workshop
- VectorVest 7 EOD
- VectorVest 7 RealTime/IntraDay
- VectorVest AutoTester
- VectorVest Educational Services
- VectorVest OnLine
- VectorVest Options Analyzer
- VectorVest ProGraphics v6.0
- VectorVest ProTrader 7
- VectorVest RealTime Derby Tool
- VectorVest Simulator
- VectorVest Variator
- VectorVest Watchdog
- StockCharts.com, Inc.
- Candle Patterns
- Candlestick Charting Explained
- Intermarket Technical Analysis
- John Murphy on Chart Analysis
- John Murphy's Chart Pattern Recognition
- John Murphy's Market Message
- MurphyExplainsMarketAnalysis-Intermarket Analysis
- MurphyExplainsMarketAnalysis-Visual Analysis
- StockCharts.com
- Technical Analysis of the Financial Markets
- The Visual Investor
