

HOT TOPICS LIST
- MACD
- Fibonacci
- RSI
- Gann
- ADXR
- Stochastics
- Volume
- Triangles
- Futures
- Cycles
- Volatility
- ZIGZAG
- MESA
- Retracement
- Aroon
INDICATORS LIST
LIST OF TOPICS
PRINT THIS ARTICLE
by Stella Osoba, CMT
Donald Lambert developed the Commodities Channel Index, which as the name implies was originally intended to be used with commodities trading. However, this indicator has been successfully applied to other markets, including stocks.
Position: N/A
Stella Osoba, CMT
Stella Osoba is a trader and financial writer. She is a frequent contributor to "Technical Analysis of Stocks and Commodities" magazine and "Traders.com Advantage" as well as other financial publications.
PRINT THIS ARTICLE
TECHNICAL INDICATORS
Trading Signals and the Commodity Channel Index
01/30/17 02:06:03 PMby Stella Osoba, CMT
Donald Lambert developed the Commodities Channel Index, which as the name implies was originally intended to be used with commodities trading. However, this indicator has been successfully applied to other markets, including stocks.
Position: N/A
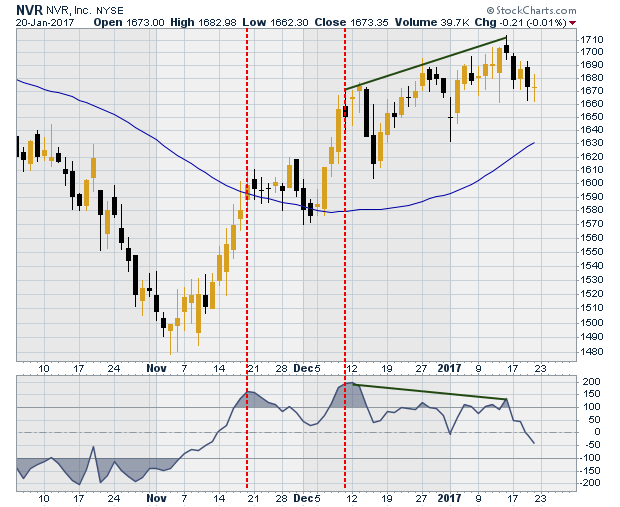
| As with any indicator, understanding what it is designed to measure and how it is calculated is the key to using it successfully. The CCI measures the price of a security relative to its average price over a specified period of time. When the CCI rises to high levels, it simply means that the current price of the security is above its specified average price and vice versa, when the CCI drops to low levels, it means that the price of the security is below a specified average price. The chart below uses a default 20-period setting parameter. |
| Using the CCI as a Coincident Indicator The CCI is an unbounded indicator meaning that it fluctuates around a central line, but does not have upper or lower boundaries. High readings can often be subjective and it is therefore important to study the security being analyzed to decide what levels can be marked as high or low. Often, high readings for one security may be normal for another, depending on the volatility of the particular security. When using the CCI as a coincident indicator, the idea is to look to use high readings as a signal of strength and a foreshadowing of a significant move. |
| See the chart of NVR (NVR) below in Figure 1. The CCI is reproduced in the panel below the price chart. In mid-November 2016 and mid-December 2016, the CCI moves above 100. (See red dotted lines) The initial move foreshadows strength. Looking at the chart, price has just closed above its 50-day moving average. The second rise above 100 is even stronger and represents a continuation of the uptrend. Using the CCI as a coincident indicator and trading in the direction of the trend would be the correct interpretation of the CCI in this instance. |
|
| Figure 1. Daily chart of NVR with CCI indicator. |
| Graphic provided by: StockCharts.com. |
| |
| Using the CCI as a Leading Indicator The CCI is a versatile indicator and as well as being used as a coincident indicator, it can also be used as a leading indicator. Sometimes, though not always, divergences appear which can foreshadow a trend reversal. (Green lines on chart in Figure 1) During these times, the CCI should be used as a leading indicator of impending price action. In the chart of NVR a bearish divergence has appeared. Price is making higher highs while the CCI is not. This reduction in momentum could foreshadow underlying weakness and an impending trend reversal. At this stage, caution is advised because when there is a strong trend, divergences can be misleading. The last candle to form on this chart is a doji. It is wise to step back and let price action tell you what it will do because not all divergences will work. |
|
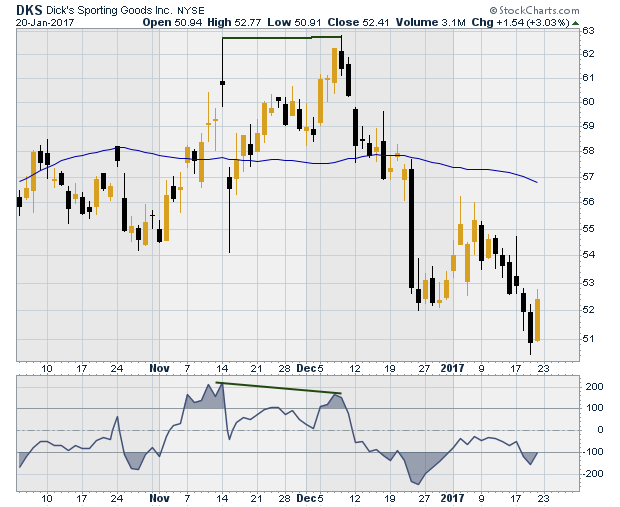
| Figure 2. Daily chart of DKS showing divergence between price and the CCI indicator. |
| Graphic provided by: StockCharts.com. |
| |
| The chart in Figure 2 shows Dick's Sporting Goods Inc. (DKS) Here is an example of a divergence that worked. In this case, the negative divergence with the CCI results in a trend reversal and significant bearish price action. |
Stella Osoba is a trader and financial writer. She is a frequent contributor to "Technical Analysis of Stocks and Commodities" magazine and "Traders.com Advantage" as well as other financial publications.
| E-mail address: | stellaosoba@gmail.com |
Click here for more information about our publications!
PRINT THIS ARTICLE

Request Information From Our Sponsors
- StockCharts.com, Inc.
- Candle Patterns
- Candlestick Charting Explained
- Intermarket Technical Analysis
- John Murphy on Chart Analysis
- John Murphy's Chart Pattern Recognition
- John Murphy's Market Message
- MurphyExplainsMarketAnalysis-Intermarket Analysis
- MurphyExplainsMarketAnalysis-Visual Analysis
- StockCharts.com
- Technical Analysis of the Financial Markets
- The Visual Investor
- VectorVest, Inc.
- Executive Premier Workshop
- One-Day Options Course
- OptionsPro
- Retirement Income Workshop
- Sure-Fire Trading Systems (VectorVest, Inc.)
- Trading as a Business Workshop
- VectorVest 7 EOD
- VectorVest 7 RealTime/IntraDay
- VectorVest AutoTester
- VectorVest Educational Services
- VectorVest OnLine
- VectorVest Options Analyzer
- VectorVest ProGraphics v6.0
- VectorVest ProTrader 7
- VectorVest RealTime Derby Tool
- VectorVest Simulator
- VectorVest Variator
- VectorVest Watchdog