

HOT TOPICS LIST
- MACD
- Fibonacci
- RSI
- Gann
- ADXR
- Stochastics
- Volume
- Triangles
- Futures
- Cycles
- Volatility
- ZIGZAG
- MESA
- Retracement
- Aroon
INDICATORS LIST
LIST OF TOPICS
PRINT THIS ARTICLE
by Stella Osoba, CMT
Dawn's early light is the Sanskrit name that Tuschar Chande gave to an indicator he developed in 1995. The Aroon indicator consists of two separate lines; the Aroon-Up and the Aroon-Down. We will use the chart of Intuit, Inc. (INTU) to study how this useful indicator can help us spot trend reversals as they are beginning.
Position: N/A
Stella Osoba, CMT
Stella Osoba is a trader and financial writer. She is a frequent contributor to "Technical Analysis of Stocks and Commodities" magazine and "Traders.com Advantage" as well as other financial publications.
PRINT THIS ARTICLE
AROON
Using Dawn's Early Light To Spot Early Trend Reversals
01/25/17 04:14:29 PMby Stella Osoba, CMT
Dawn's early light is the Sanskrit name that Tuschar Chande gave to an indicator he developed in 1995. The Aroon indicator consists of two separate lines; the Aroon-Up and the Aroon-Down. We will use the chart of Intuit, Inc. (INTU) to study how this useful indicator can help us spot trend reversals as they are beginning.
Position: N/A
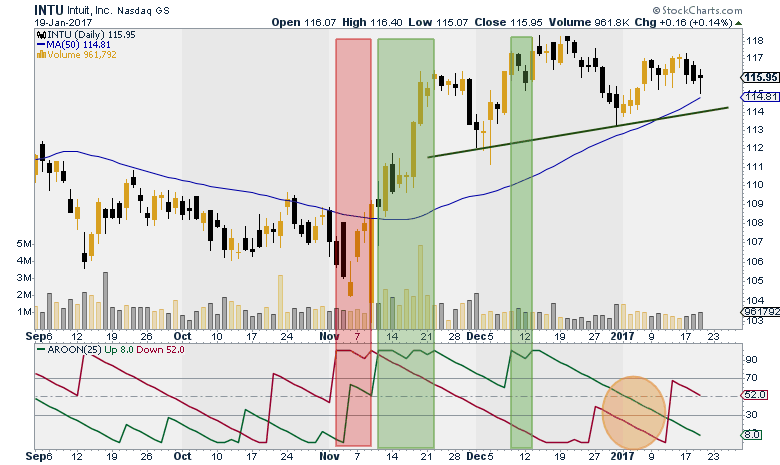
| Unlike many other more typical indicators which focus on price relative to time, the Aroon indicator is different because it focuses on time relative to price. It does this by measuring the number of days since a high or low price was reached. Note: The chart of INTU reproduced below uses a 25-day default setting. |
|
| Figure 1. Daily chart for INTU with AROON indicator. |
| Graphic provided by: StockCharts.com. |
| |
| In early November 2016, the red shaded rectangle highlighted above shows the Aroon-Down line has risen to 100. This means that the price over the look-back period of 25 days was registering new lows. While this information is useful, it should be used in concert with the Aroon-Up line. Since the Aroon-Up was also rising and above the centerline at 50, we should have had reason to suspect the staying power of the downtrend. By mid-November the Aroon-Up line had crossed above the Aroon-Down line. With the Aroon-Down line also falling steeply and crossing below 50, we were given a warning that a new up-trend was now in effect. (Green shaded rectangle). |
| The second green shaded rectangle on the chart shows why it pays to wait for price confirmation before taking any signals produced by an indicator. The Aroon-Up had surged to 100 but had no staying power. The shooting star candlestick just outside the green shaded box was registering a new high price, but this in and of itself was a bearish signal. Sure enough, the Aroon-Up soon reversed downwards and fell steeply as the Aroon-Down also fell. The area highlighted by the orange circle shows both the Aroon-Up and the Aroon-Down moving lower while forming parallel lines. When this happens and the lines are close, price is usually consolidating. |
| In January 2017, the Aroon indicator showed price continuing to consolidate as a right shoulder in a head-and-shoulders top pattern formed. Then the Aroon-Down began to move upwards ahead of the Aroon-Up. The Aroon-Down line crossed above the Aroon-Up line from below and touched 70 before retreating to the center line. Both the Aroon-Up and Aroon-Down lines were now parallel and moving down, albeit with the Aroon-Down line above the Aroon-Up line. The head-and-shoulders top which is still being formed has yet to cross the neckline indicated by the dark green line on the chart, when this bearish pattern will be complete. Look for a rise in the Aroon-Down line to 100 and for the Aroon-Up line to remain at low levels for early indications of the beginning of a new downtrend. |
| Learning to interpret the signals given by the Aroon indicator is a useful aid to add to your analysis toolkit. |
Stella Osoba is a trader and financial writer. She is a frequent contributor to "Technical Analysis of Stocks and Commodities" magazine and "Traders.com Advantage" as well as other financial publications.
| E-mail address: | stellaosoba@gmail.com |
Click here for more information about our publications!
Comments

Request Information From Our Sponsors
- StockCharts.com, Inc.
- Candle Patterns
- Candlestick Charting Explained
- Intermarket Technical Analysis
- John Murphy on Chart Analysis
- John Murphy's Chart Pattern Recognition
- John Murphy's Market Message
- MurphyExplainsMarketAnalysis-Intermarket Analysis
- MurphyExplainsMarketAnalysis-Visual Analysis
- StockCharts.com
- Technical Analysis of the Financial Markets
- The Visual Investor
- VectorVest, Inc.
- Executive Premier Workshop
- One-Day Options Course
- OptionsPro
- Retirement Income Workshop
- Sure-Fire Trading Systems (VectorVest, Inc.)
- Trading as a Business Workshop
- VectorVest 7 EOD
- VectorVest 7 RealTime/IntraDay
- VectorVest AutoTester
- VectorVest Educational Services
- VectorVest OnLine
- VectorVest Options Analyzer
- VectorVest ProGraphics v6.0
- VectorVest ProTrader 7
- VectorVest RealTime Derby Tool
- VectorVest Simulator
- VectorVest Variator
- VectorVest Watchdog