HOT TOPICS LIST
- MACD
- Fibonacci
- RSI
- Gann
- ADXR
- Stochastics
- Volume
- Triangles
- Futures
- Cycles
- Volatility
- ZIGZAG
- MESA
- Retracement
- Aroon
INDICATORS LIST
LIST OF TOPICS
PRINT THIS ARTICLE
by Koos van der Merwe
The price of the cheapest 3D printer dropped from $18,000 to $400 within 10 years.
Position: Accumulate
Koos van der Merwe
Has been a technical analyst since 1969, and has worked as a futures and options trader with First Financial Futures in Johannesburg, South Africa.
PRINT THIS ARTICLE
TECHNICAL INDICATORS
A Gamble For The Future
01/18/17 01:53:07 PMby Koos van der Merwe
The price of the cheapest 3D printer dropped from $18,000 to $400 within 10 years.
Position: Accumulate
| Over the same period of time, 3D printing has become 100 times faster. Some spare airplane parts are already being printed with 3D printers. The space station has a 3D printer that eliminates the need for the large amount of spare parts needed. The future of 3D printing is obvious. The price of 3D printers could drop even further, and as the years pass, more and more products will be produced by 3D printers. Taking a gamble now and buying the share for a long-term hold could well be the way to go for the future. |

|
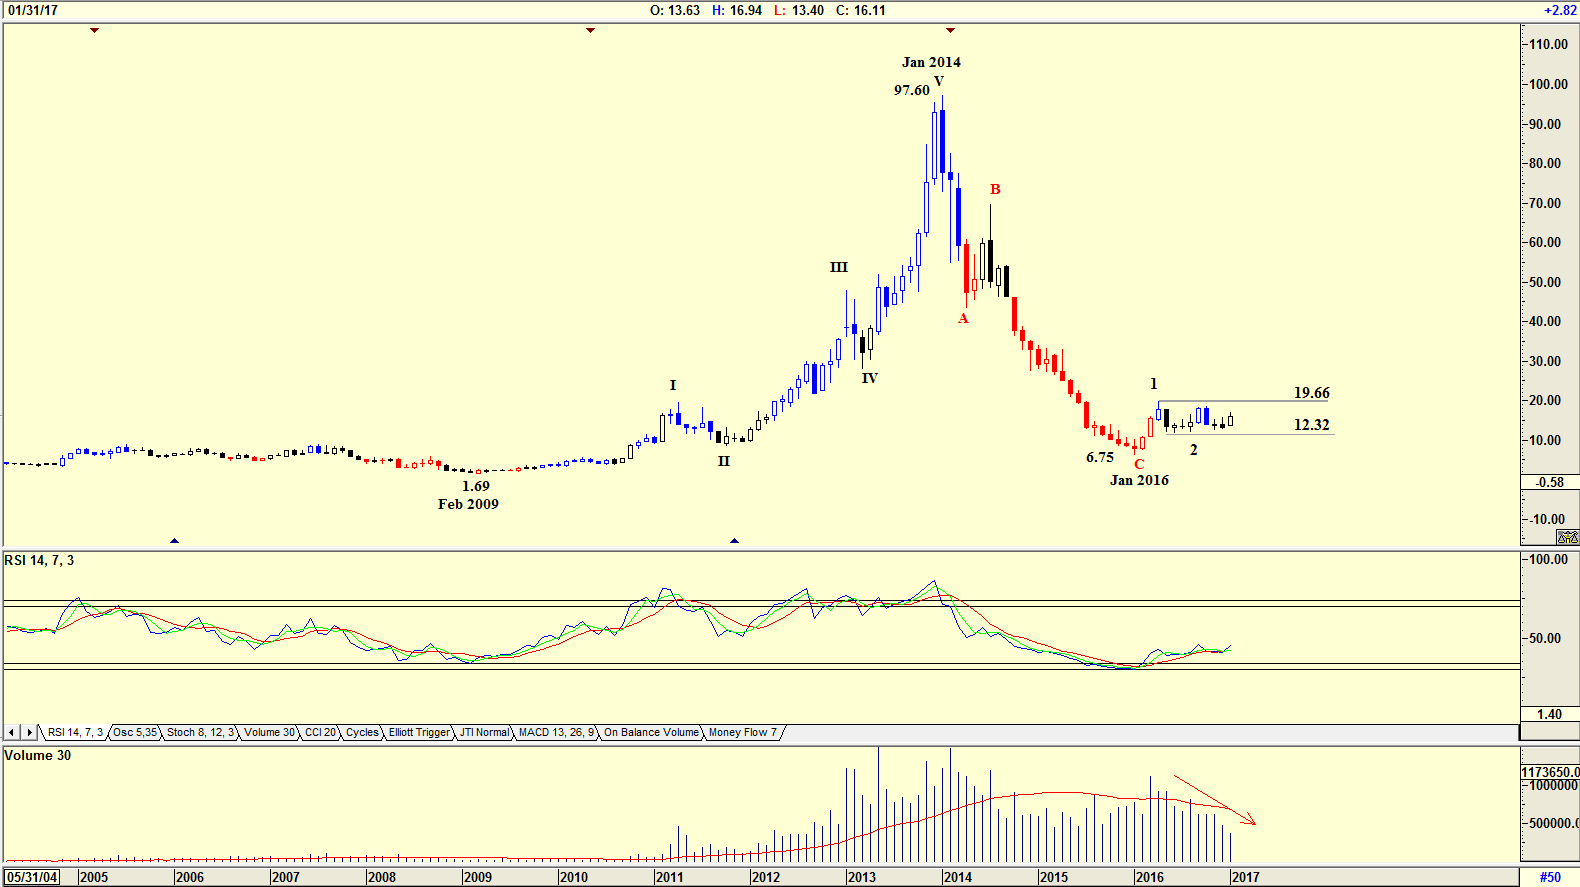
| Figure 1. Monthly chart of DDD with Elliott wave count. |
| Graphic provided by: AdvancedGET. |
| |
| The chart in Figure 1 is a monthly chart showing how the share price rose from a low of $1.69 in February 2009 in an Elliott wave count to a WAVE V top of $97.60 in January 2014. From that level the share price dropped in an ABC correction, bottoming at $6.75 in January 2016. The share price is presently trading at $16.11 in what appears to be a Wave 1 and Wave 2. Volume has, however, fallen as the share price moved sideways suggesting possible weakness ahead, but the RSI indicator is suggesting strength. A rising share price on falling volume suggests weakness. A falling share price on falling volume suggests strength. A share price moving sideways on falling volume suggests either a rise or a fall. The chart shows that $12.32 suggests support, and a move above $19.66, a strong buy. |

|
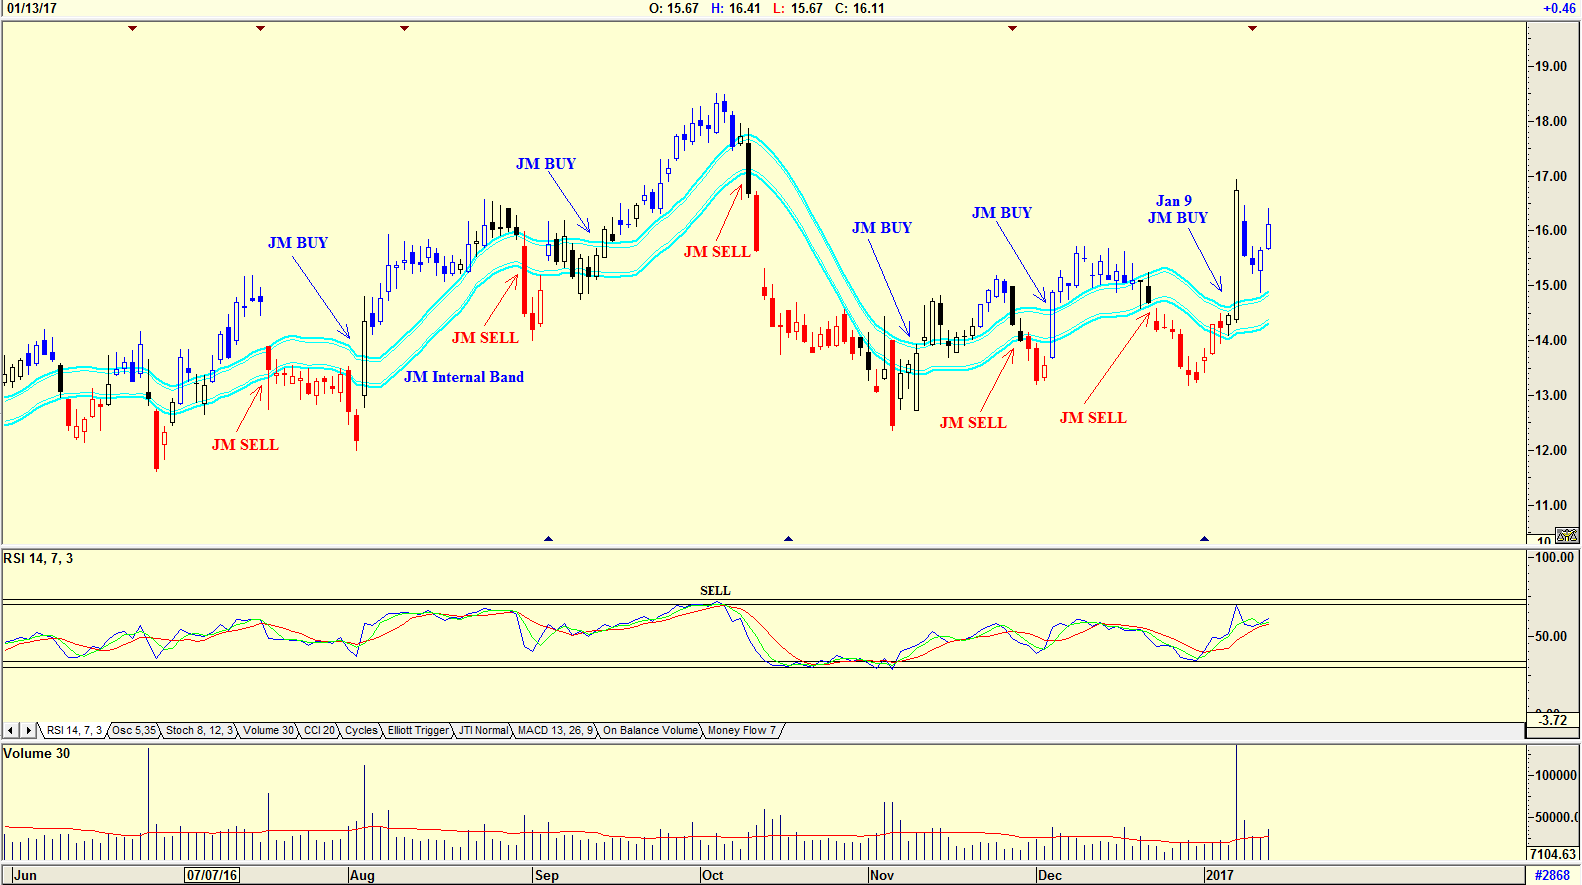
| Figure 2. Daily chart of DDD with JM Internal Band. |
| Graphic provided by: AdvancedGET. |
| |
| The chart in Figure 2 is a daily chart with a JM Internal band showing that the share price gave a buy on January 9th. The JM Internal Band is a 15 period simple moving average offset by 2% positive and 2% negative. A move above the upper band suggests a buy and below the lower band a sell. The RSI indicator has not given a sell signal, but it is close to being overbought. Volume rose as the share price rose on January 13th, suggesting strength. 3D Systems Corp is a share that one should add to a watch list. 3D printing is the future, but as the price of 3D printers continues to fall, the share price could fall with it. However as the price of 3D printers fall, more and more companies will turn to 3D printers to produce merchandise. A buy and hold for the very long term is therefore a chance one can take. |
Has been a technical analyst since 1969, and has worked as a futures and options trader with First Financial Futures in Johannesburg, South Africa.
| Address: | 3256 West 24th Ave |
| Vancouver, BC | |
| Phone # for sales: | 6042634214 |
| E-mail address: | petroosp@gmail.com |
Click here for more information about our publications!
PRINT THIS ARTICLE

|

Request Information From Our Sponsors
- StockCharts.com, Inc.
- Candle Patterns
- Candlestick Charting Explained
- Intermarket Technical Analysis
- John Murphy on Chart Analysis
- John Murphy's Chart Pattern Recognition
- John Murphy's Market Message
- MurphyExplainsMarketAnalysis-Intermarket Analysis
- MurphyExplainsMarketAnalysis-Visual Analysis
- StockCharts.com
- Technical Analysis of the Financial Markets
- The Visual Investor
- VectorVest, Inc.
- Executive Premier Workshop
- One-Day Options Course
- OptionsPro
- Retirement Income Workshop
- Sure-Fire Trading Systems (VectorVest, Inc.)
- Trading as a Business Workshop
- VectorVest 7 EOD
- VectorVest 7 RealTime/IntraDay
- VectorVest AutoTester
- VectorVest Educational Services
- VectorVest OnLine
- VectorVest Options Analyzer
- VectorVest ProGraphics v6.0
- VectorVest ProTrader 7
- VectorVest RealTime Derby Tool
- VectorVest Simulator
- VectorVest Variator
- VectorVest Watchdog
