HOT TOPICS LIST
- MACD
- Fibonacci
- RSI
- Gann
- ADXR
- Stochastics
- Volume
- Triangles
- Futures
- Cycles
- Volatility
- ZIGZAG
- MESA
- Retracement
- Aroon
INDICATORS LIST
LIST OF TOPICS
PRINT THIS ARTICLE
by Koos van der Merwe
The market is waiting for the Dow to break above 20000.
Position: Accumulate
Koos van der Merwe
Has been a technical analyst since 1969, and has worked as a futures and options trader with First Financial Futures in Johannesburg, South Africa.
PRINT THIS ARTICLE
TECHNICAL ANALYSIS
That Elusive Dow 20,000
01/11/17 04:12:28 PMby Koos van der Merwe
The market is waiting for the Dow to break above 20000.
Position: Accumulate
| On Friday, January 6th, 2017, the Dow Jones rose to a high of 19999.63. The market expected the Dow Jones to break through the 20,000 high, but it did not, to much disappointment. The Trump rally is fast approaching Inauguration Day on January 20th, when Donald Trump will put his hand on the bible and take the oath of office, officially becoming President of the United States. Until then, anything could happen that could depress the Dow. However, from that date on, the US government is officially in the hands of Donald Trump and market enthusiasm, as shown by him winning the election, should continue. The question on everyone's mind is, will the Dow Jones break above the 20,000 level before or after his inauguration? Of course, the other question is, will the Dow Jones break above the 20,000 at all? Technical analysis says, "maybe". |

|
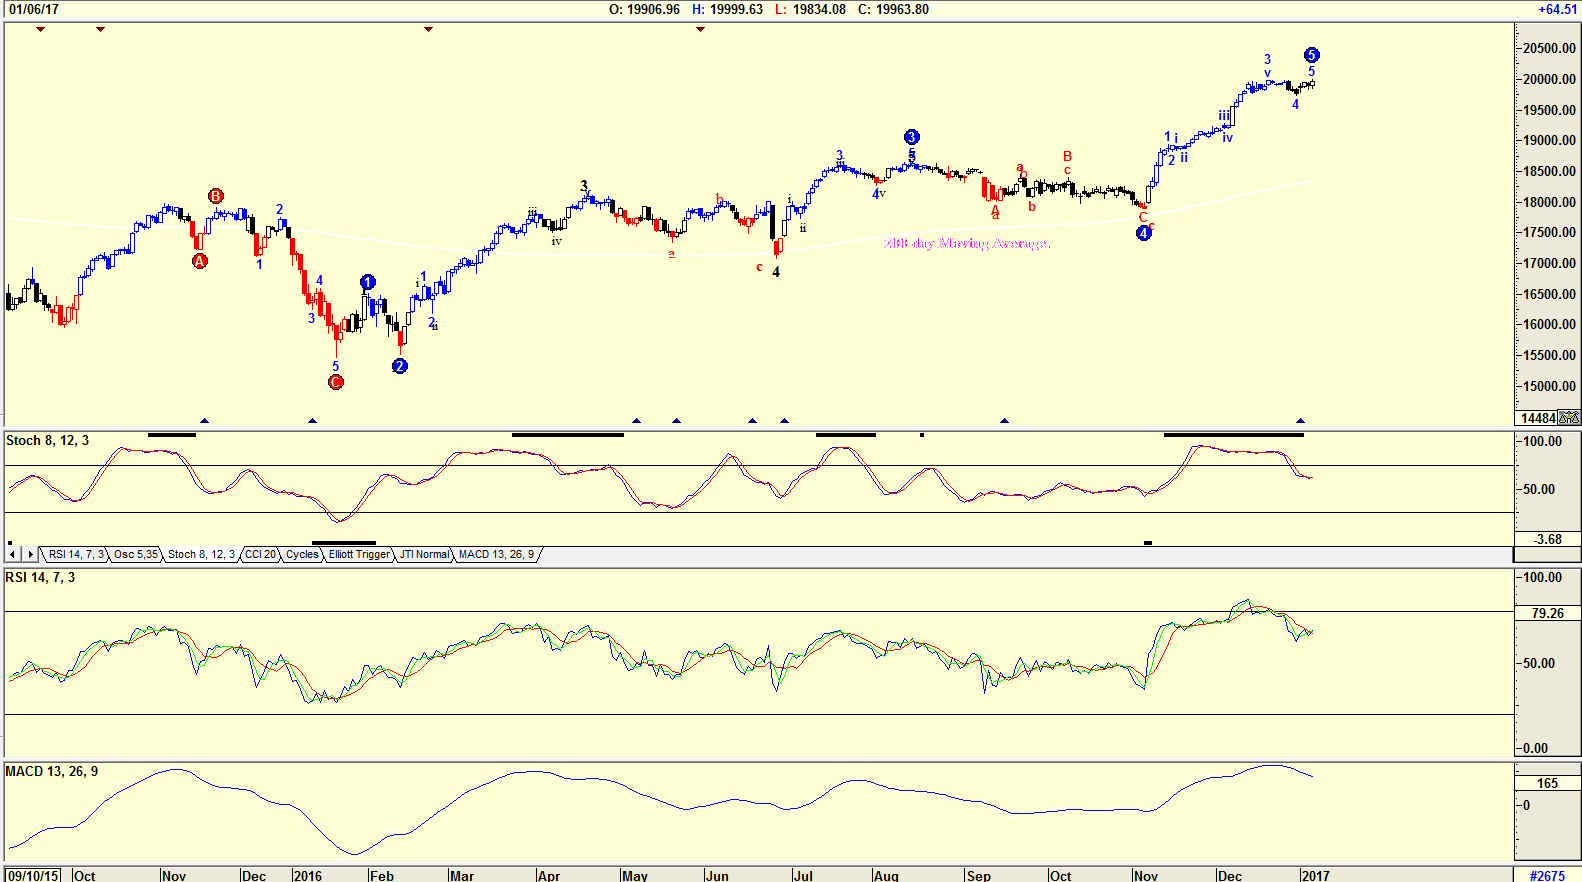
| Figure 1. Daily chart of the Dow Jones. |
| Graphic provided by: AdvancedGET. |
| |
| The chart in Figure 1 is a daily chart of the Dow Jones showing an Elliott wave count suggesting that the Dow is completing a WAVE 5, and should now correct in an ABC. All three indicators shown below the chart — the Stochastic, RSI and MACD indicators — have all given sell signals. |

|
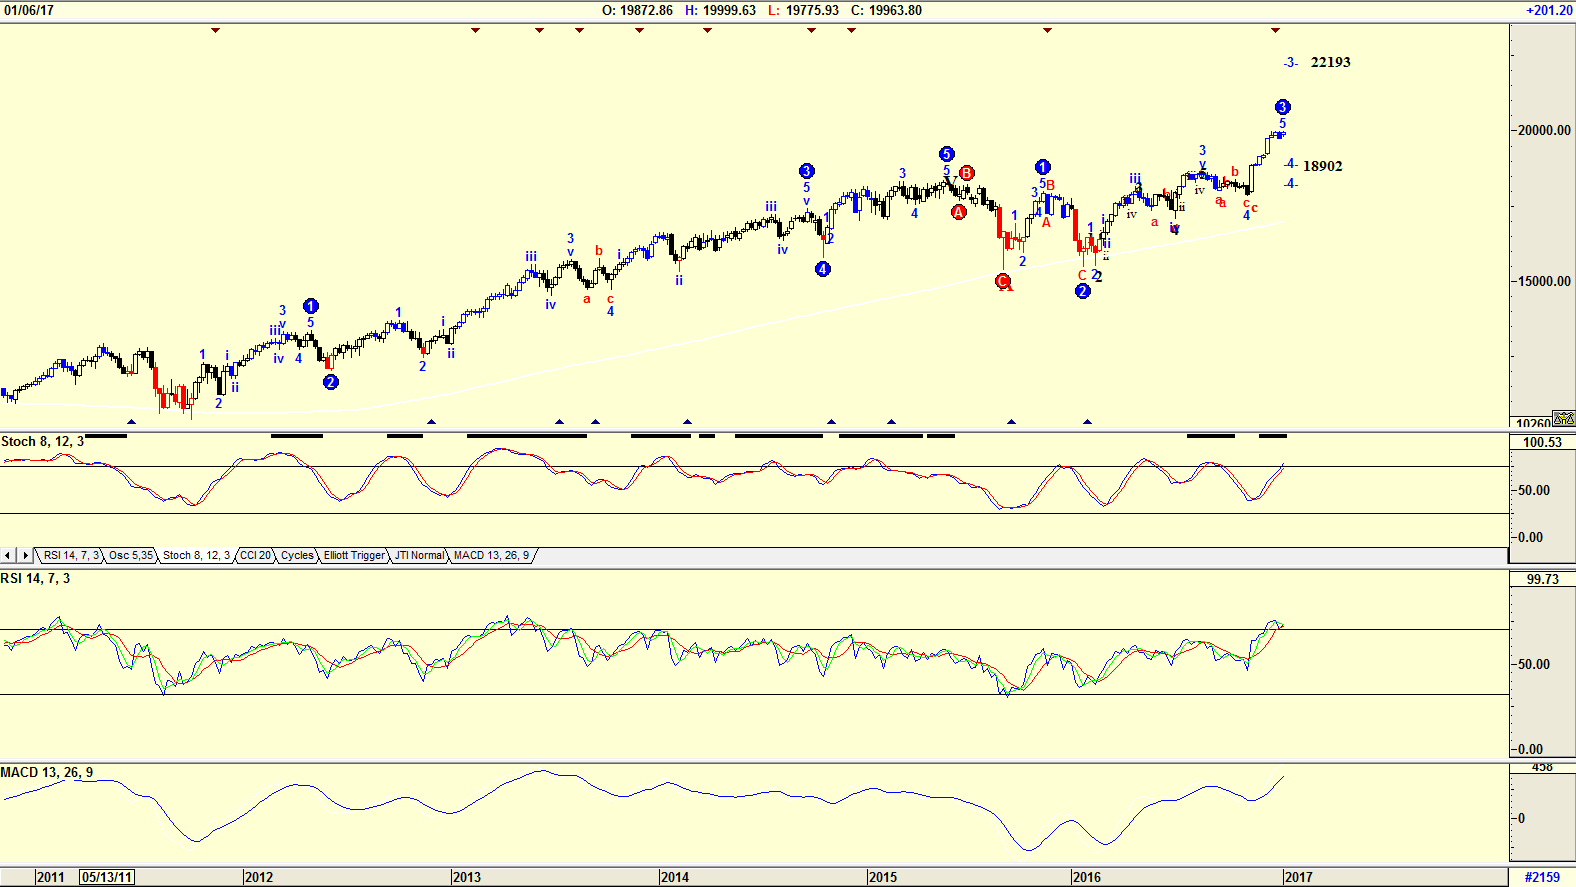
| Figure 2. Weekly chart of the Dow Jones. |
| Graphic provided by: AdvancedGET. |
| |
| The weekly chart in Figure 2 has an Elliott wave count suggesting that the Dow is tracing a WAVE 3 with the possibility that the WAVE 3 could rise to 22,193, and could fall to 18,02 before rising. Not one of the three indicators have given a sell signal, suggesting that the Dow could well break above the 20,000 level. |

|
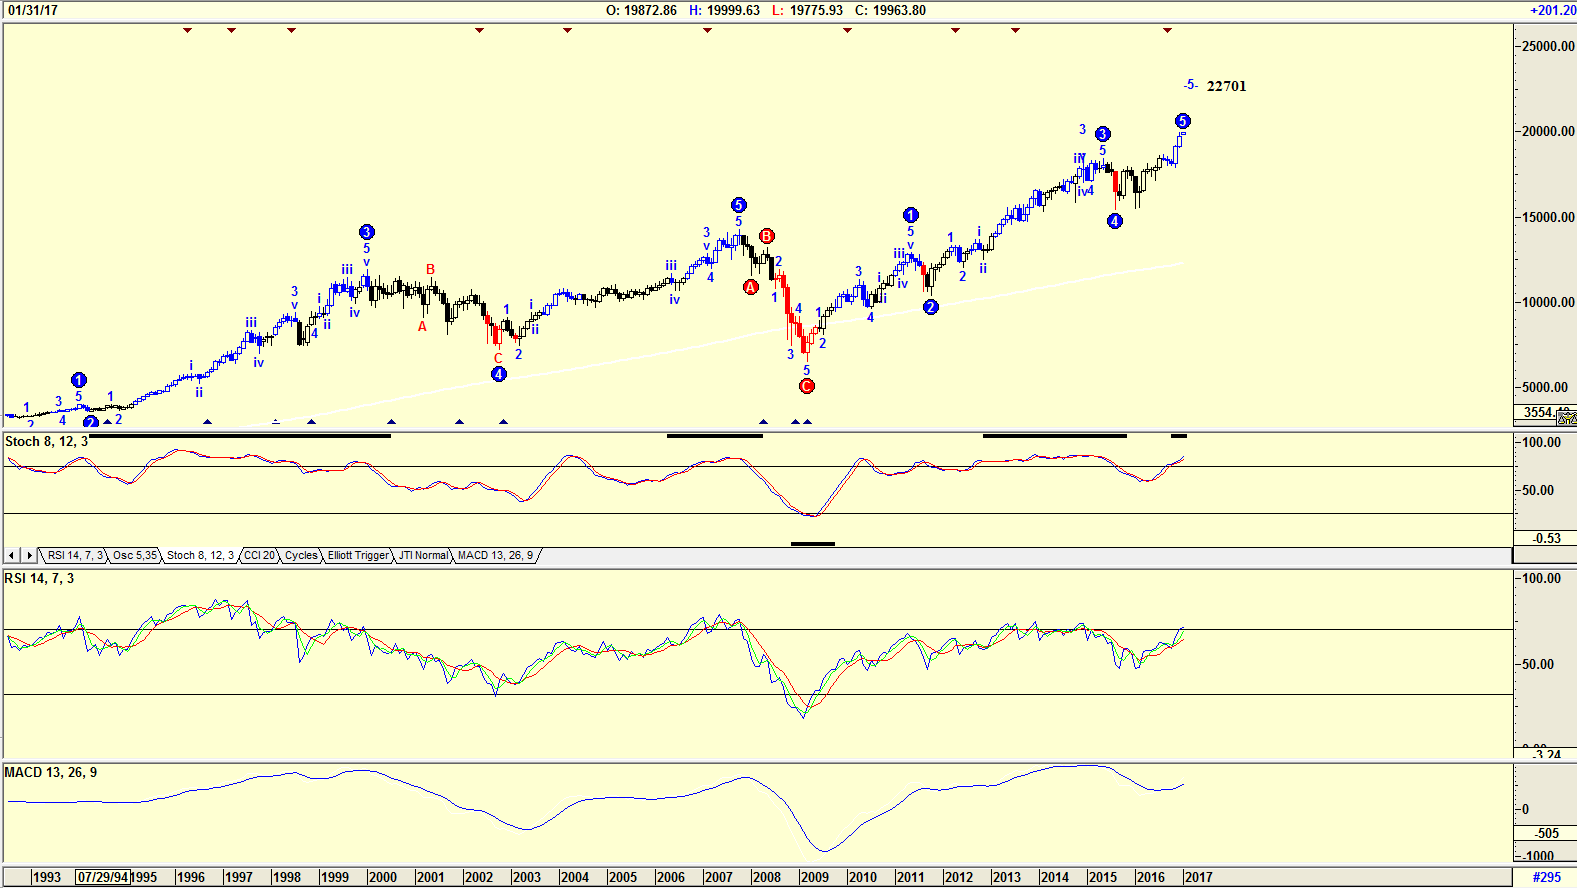
| Figure 3. Monthly chart of the Dow Jones. |
| Graphic provided by: AdvancedGET. |
| |
| The chart in Figure 3 is a monthly chart, with an Elliott wave count suggesting that the WAVE 5 could rise as high as 22,701. All three indicators are at overbought levels, but none have suggested a sell just yet. The Dow Jones is bullish, suggesting that with the inauguration of Donald Trump as President of the United States it will continue rising. Of course, there is always the unexpected that could happen which would cause the Dow Jones to collapse, like an inappropriate tweet. |
Has been a technical analyst since 1969, and has worked as a futures and options trader with First Financial Futures in Johannesburg, South Africa.
| Address: | 3256 West 24th Ave |
| Vancouver, BC | |
| Phone # for sales: | 6042634214 |
| E-mail address: | petroosp@gmail.com |
Click here for more information about our publications!
PRINT THIS ARTICLE

|

Request Information From Our Sponsors
- StockCharts.com, Inc.
- Candle Patterns
- Candlestick Charting Explained
- Intermarket Technical Analysis
- John Murphy on Chart Analysis
- John Murphy's Chart Pattern Recognition
- John Murphy's Market Message
- MurphyExplainsMarketAnalysis-Intermarket Analysis
- MurphyExplainsMarketAnalysis-Visual Analysis
- StockCharts.com
- Technical Analysis of the Financial Markets
- The Visual Investor
- VectorVest, Inc.
- Executive Premier Workshop
- One-Day Options Course
- OptionsPro
- Retirement Income Workshop
- Sure-Fire Trading Systems (VectorVest, Inc.)
- Trading as a Business Workshop
- VectorVest 7 EOD
- VectorVest 7 RealTime/IntraDay
- VectorVest AutoTester
- VectorVest Educational Services
- VectorVest OnLine
- VectorVest Options Analyzer
- VectorVest ProGraphics v6.0
- VectorVest ProTrader 7
- VectorVest RealTime Derby Tool
- VectorVest Simulator
- VectorVest Variator
- VectorVest Watchdog
