HOT TOPICS LIST
- MACD
- Fibonacci
- RSI
- Gann
- ADXR
- Stochastics
- Volume
- Triangles
- Futures
- Cycles
- Volatility
- ZIGZAG
- MESA
- Retracement
- Aroon
INDICATORS LIST
LIST OF TOPICS
PRINT THIS ARTICLE
by Koos van der Merwe
With the start of the year 2017, and a new President taking over in the United States of America, looking for a share to buy and hold is not that easy.
Position: Accumulate
Koos van der Merwe
Has been a technical analyst since 1969, and has worked as a futures and options trader with First Financial Futures in Johannesburg, South Africa.
PRINT THIS ARTICLE
TECHNICAL ANALYSIS
Looking For A Share To Buy
01/04/17 03:08:18 PMby Koos van der Merwe
With the start of the year 2017, and a new President taking over in the United States of America, looking for a share to buy and hold is not that easy.
Position: Accumulate
| President elect Donald Trump is scheduled to take office as the 45th President of the United States of America on January 20th, 2017. With the transition from the current President, Barack Obama, to Donald Trump turning tense, as they tread on each other and complicate the transition to the White House, the share market is beginning to look risky. President Obama slammed Russia with a series of sanctions and diplomatic censures in response to a US intelligence assessment that Moscow interfered in the Presidential election. Obama also broke with decades of US policy and allowed a UN resolution to pass condemning Israel for building settlements in Judea and Samaria. Surprisingly, Russian President Vladimir Putin held off taking retaliatory action preferring to wait and see how relations with the Trump administration would pan out. Market uncertainty exists. Looking for a share to buy and hold is not that easy. One share, however, that has captured my attention is VISA. |

|
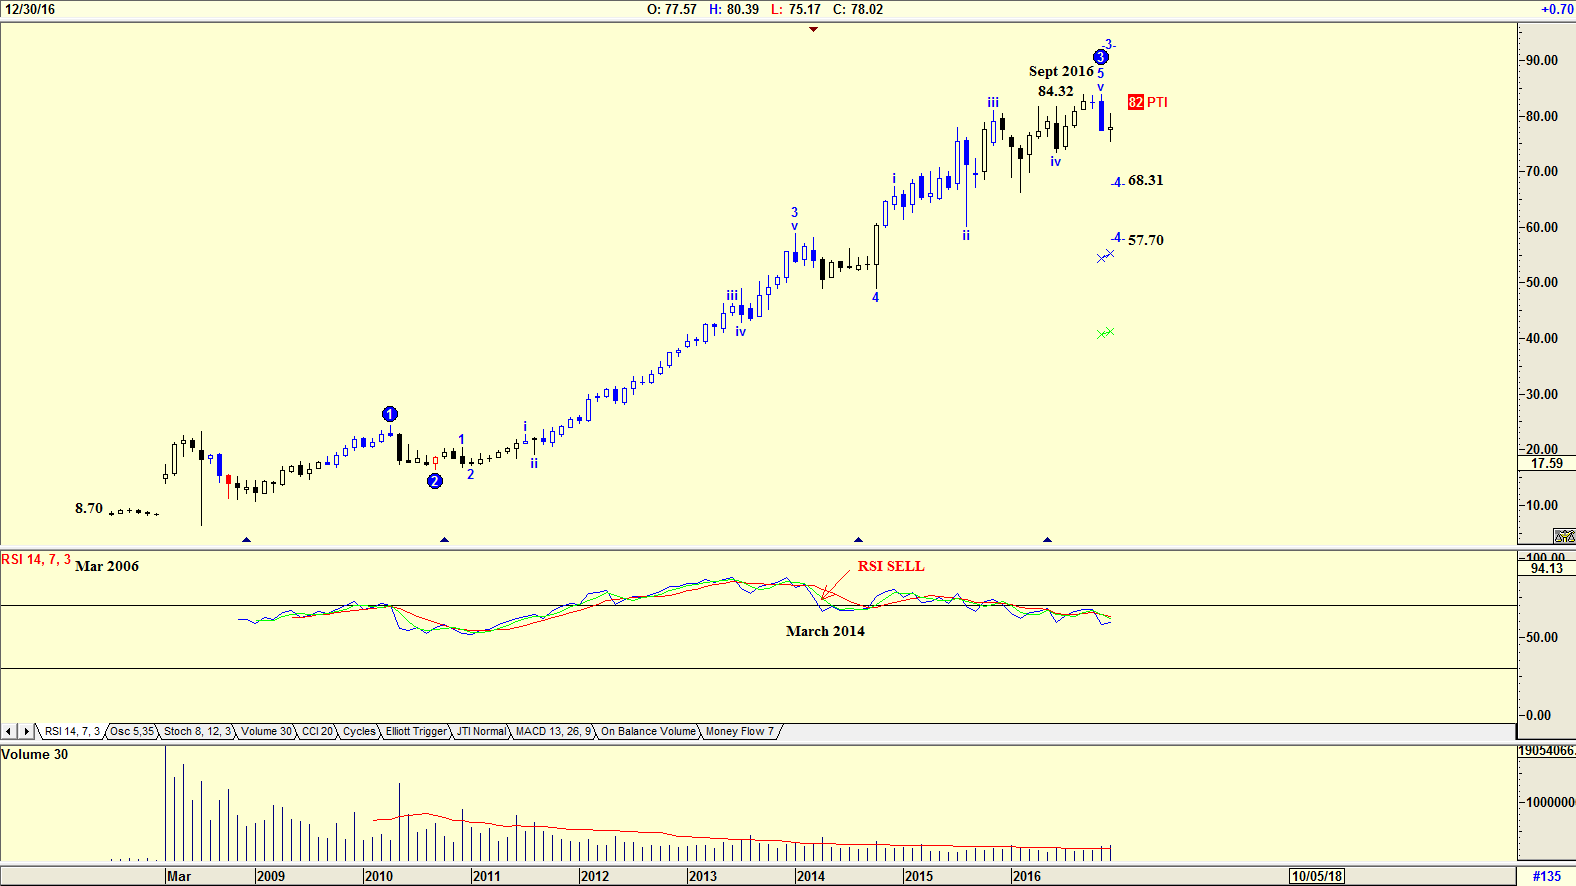
| Figure 1. Monthly Chart of VISA. |
| Graphic provided by: AdvancedGET. |
| |
| The chart in Figure 1 is a monthly chart showing how the share price rose from a low of $8.70 in March 2006 to a high of $84,32 by September 2016. The Elliott wave count suggests that the share price is in a WAVE 4 correction and could fall to either $68.31 or $57.70. Do note the RSI indicator is falling from an overbought position. |

|
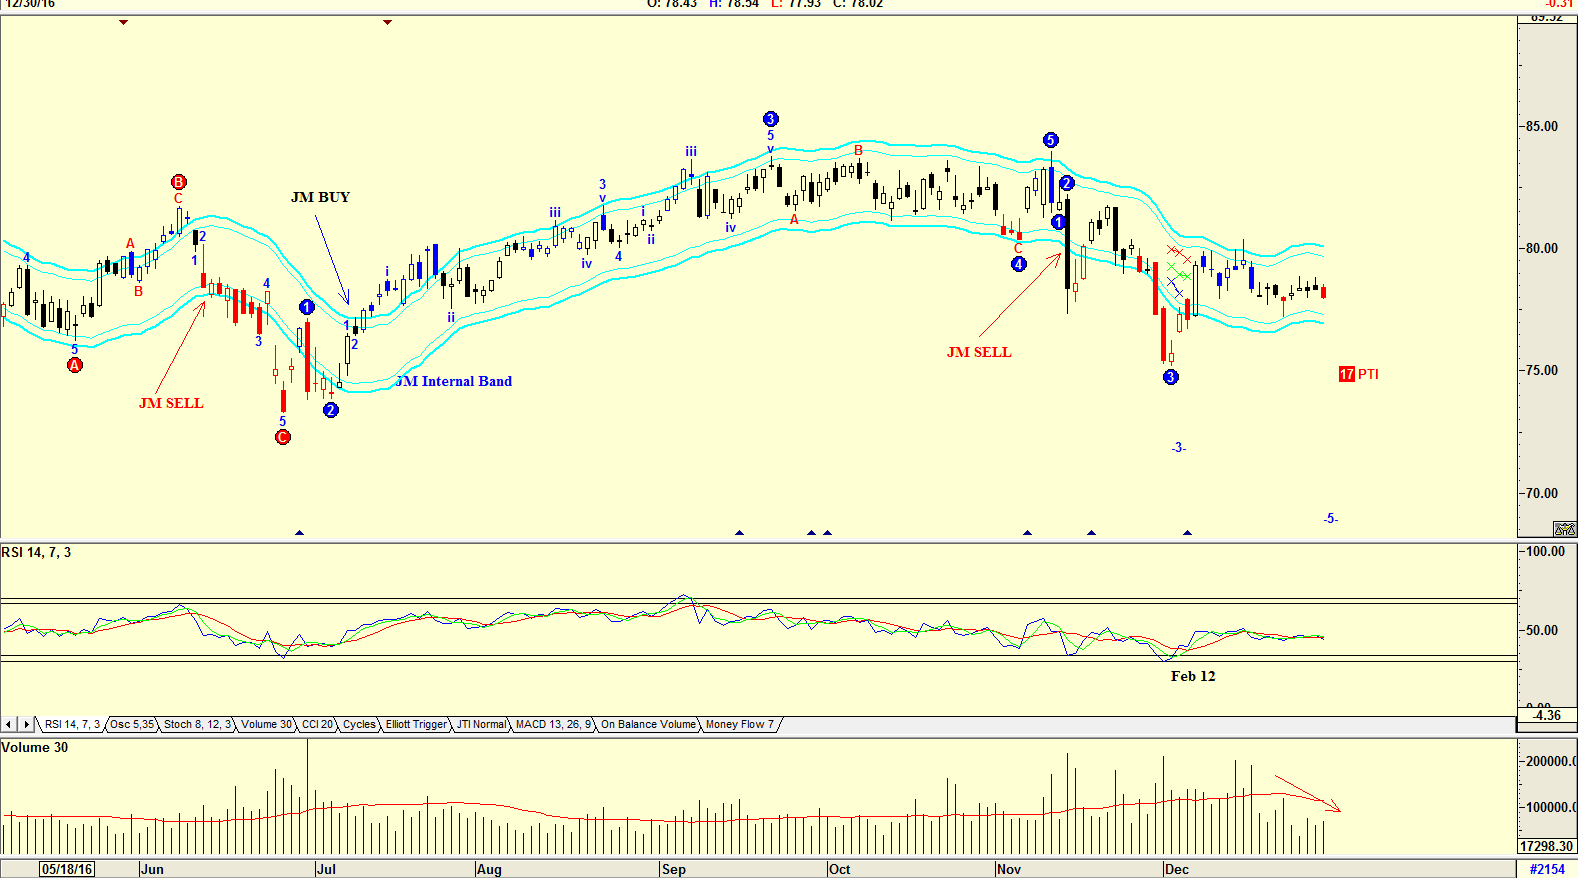
| Figure 2. Daily Chart of VISA. |
| Graphic provided by: AdvancedGET. |
| |
| The chart in Figure 2 is a daily chart with a JM Internal Band. A JM Internal Band is a 15-period simple moving average offset by 2% plus and 2% negative. A move above the upper band suggests a buy, and below the lower band a sell. The share price gave a sell on November 14th, and although it rose and tested the upper band, it has not yet given a buy signal. The RSI indicator gave a buy on February 12th. Do note the volume which is falling as the share price trended sideways, a sign of strength. Shares of VISA can be slowly accumulated based on the RSI indicator and falling volume. Cautious investors could however wait for the share price to move above the upper band of the JM Internal Band indicator. |
Has been a technical analyst since 1969, and has worked as a futures and options trader with First Financial Futures in Johannesburg, South Africa.
| Address: | 3256 West 24th Ave |
| Vancouver, BC | |
| Phone # for sales: | 6042634214 |
| E-mail address: | petroosp@gmail.com |
Click here for more information about our publications!
PRINT THIS ARTICLE

Request Information From Our Sponsors
- StockCharts.com, Inc.
- Candle Patterns
- Candlestick Charting Explained
- Intermarket Technical Analysis
- John Murphy on Chart Analysis
- John Murphy's Chart Pattern Recognition
- John Murphy's Market Message
- MurphyExplainsMarketAnalysis-Intermarket Analysis
- MurphyExplainsMarketAnalysis-Visual Analysis
- StockCharts.com
- Technical Analysis of the Financial Markets
- The Visual Investor
- VectorVest, Inc.
- Executive Premier Workshop
- One-Day Options Course
- OptionsPro
- Retirement Income Workshop
- Sure-Fire Trading Systems (VectorVest, Inc.)
- Trading as a Business Workshop
- VectorVest 7 EOD
- VectorVest 7 RealTime/IntraDay
- VectorVest AutoTester
- VectorVest Educational Services
- VectorVest OnLine
- VectorVest Options Analyzer
- VectorVest ProGraphics v6.0
- VectorVest ProTrader 7
- VectorVest RealTime Derby Tool
- VectorVest Simulator
- VectorVest Variator
- VectorVest Watchdog
