HOT TOPICS LIST
- MACD
- Fibonacci
- RSI
- Gann
- ADXR
- Stochastics
- Volume
- Triangles
- Futures
- Cycles
- Volatility
- ZIGZAG
- MESA
- Retracement
- Aroon
INDICATORS LIST
LIST OF TOPICS
PRINT THIS ARTICLE
by Gary Grosschadl
The Nasdaq's impressive rise (similar to other indices) was finally halted by its overhead resistance line - the 200-day exponential moving average.
Position: N/A
Gary Grosschadl
Independent Canadian equities trader and technical analyst based in Peterborough
Ontario, Canada.
PRINT THIS ARTICLE
CHART ANALYSIS
Nasdaq Turned Back At Formidable Resistance
11/27/02 12:15:02 PMby Gary Grosschadl
The Nasdaq's impressive rise (similar to other indices) was finally halted by its overhead resistance line - the 200-day exponential moving average.
Position: N/A
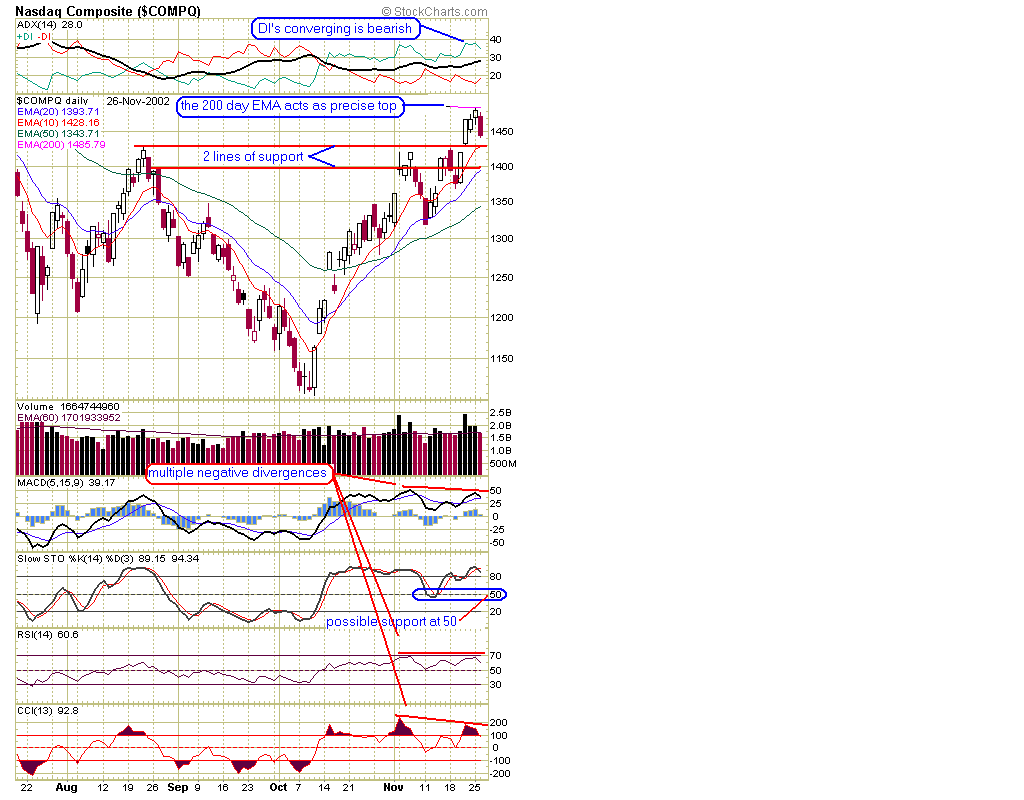
| At times the 200-period moving average acts as a surprisingly precise line of support or resistance. In this case the Nasdaq was held exactly to the 200-day exponential moving average (similar to the simple moving average, but more sensitive to recent price action), as the chart shows. |
| The burning question is, how far will it retrace? The directional movement ADX/DI indicator may give valuable insight here. This trend strength indicator (shown on the top of the chart) still has a bullish bias (although it is weakening as the DI lines converge), since the black ADX line is still in between the DI lines with + DI on top. This trader has often noted that when ADX value is strong (above 20) the resulting retracement is often to the 10- or 20-period exponential moving average (EMA). My general rule of thumb: the stronger the ADX value, the smaller the retracement. On this chart we can see how the last two retracements were held either to the 10 or 20 EMA. Since this index is still showing a bullish pattern of higher highs and higher lows, the uptrend is intact until the previous low at 1370 is broken. In this way, a brief violation of the 20 EMA (currently 1393) could occur, but a sustained move lower and all bullish bets are off in the short term. Using moving averages as a guide, if conditions worsen, the next likely support level to be tested could be the 50-day EMA, as shown on the chart (currently at 1343). |

|
| Graphic provided by: stockcharts.com. |
| |
| On the chart, two possible support lines are drawn. These coincide with the EMA lines, as discussed, and they also relate to a previous top, gap zone, and mid-candle points. |
| Mitigating factors are the multiple negative divergences (which may give added fuel to the retracement) and the possibility of a DI reversal (the DI lines actually cross). If the DI lines cross, the bears will have more power than the bulls, and could maintain control until conditions turn bullish once again. |
| So to summarize: expect a retracement to the 10 or 20 EMA, but be prepared for further downside should the 20 EMA be violated for more than a day or two -- especially any move below that previous retracement low of 1370. As a general guideline, the uptrend is still intact above the 20 EMA line, but a sustained move below this moving average and this 20 EMA becomes overhead resistance and potentially a bearish vehicle of decline. |
Independent Canadian equities trader and technical analyst based in Peterborough
Ontario, Canada.
| Website: | www.whatsonsale.ca/financial.html |
| E-mail address: | gwg7@sympatico.ca |
Click here for more information about our publications!
Comments
Date: 11/28/02Rank: 5Comment:
Date: 11/29/02Rank: 4Comment: The column format is too wide for me to read

Request Information From Our Sponsors
- VectorVest, Inc.
- Executive Premier Workshop
- One-Day Options Course
- OptionsPro
- Retirement Income Workshop
- Sure-Fire Trading Systems (VectorVest, Inc.)
- Trading as a Business Workshop
- VectorVest 7 EOD
- VectorVest 7 RealTime/IntraDay
- VectorVest AutoTester
- VectorVest Educational Services
- VectorVest OnLine
- VectorVest Options Analyzer
- VectorVest ProGraphics v6.0
- VectorVest ProTrader 7
- VectorVest RealTime Derby Tool
- VectorVest Simulator
- VectorVest Variator
- VectorVest Watchdog
- StockCharts.com, Inc.
- Candle Patterns
- Candlestick Charting Explained
- Intermarket Technical Analysis
- John Murphy on Chart Analysis
- John Murphy's Chart Pattern Recognition
- John Murphy's Market Message
- MurphyExplainsMarketAnalysis-Intermarket Analysis
- MurphyExplainsMarketAnalysis-Visual Analysis
- StockCharts.com
- Technical Analysis of the Financial Markets
- The Visual Investor
