HOT TOPICS LIST
- MACD
- Fibonacci
- RSI
- Gann
- ADXR
- Stochastics
- Volume
- Triangles
- Futures
- Cycles
- Volatility
- ZIGZAG
- MESA
- Retracement
- Aroon
INDICATORS LIST
LIST OF TOPICS
PRINT THIS ARTICLE
by Koos van der Merwe
How much longer can the market continue to rise under Trumponomics?
Position: Sell
Koos van der Merwe
Has been a technical analyst since 1969, and has worked as a futures and options trader with First Financial Futures in Johannesburg, South Africa.
PRINT THIS ARTICLE
ELLIOTT WAVE
That Word, Trumponomics.
12/14/16 02:53:43 PMby Koos van der Merwe
How much longer can the market continue to rise under Trumponomics?
Position: Sell
| The election of Donald Trump surprised the markets. The initial reaction was a strong move down overnight in the futures markets, but as reality hit the markets, reality in that a shrewd businessman was going to run America, and that he was a man who would always look to run the best strategy and not keep crazy promises made in the run up to the election, the stock market started rising. In the weeks that followed, the market continued higher with the indexes recently hitting all-time highs. The prospect of lower taxes and the promised repeal of the Dodd-Frank Act are huge pluses, but one should not forget that it was the banks offering crazy mortgage loans that caused the crash of 2008, the reason for the Dodd-Frank Act. In Canada, the Financial Minister, Paul Martin, refused to allow banks to merge, and so protected the financial market from crazy mortgage loans, something the elected President seems not to know or wishes to ignore. But then of course, one should not forget that when he needed financial assistance, it was the banks that helped him. |

|
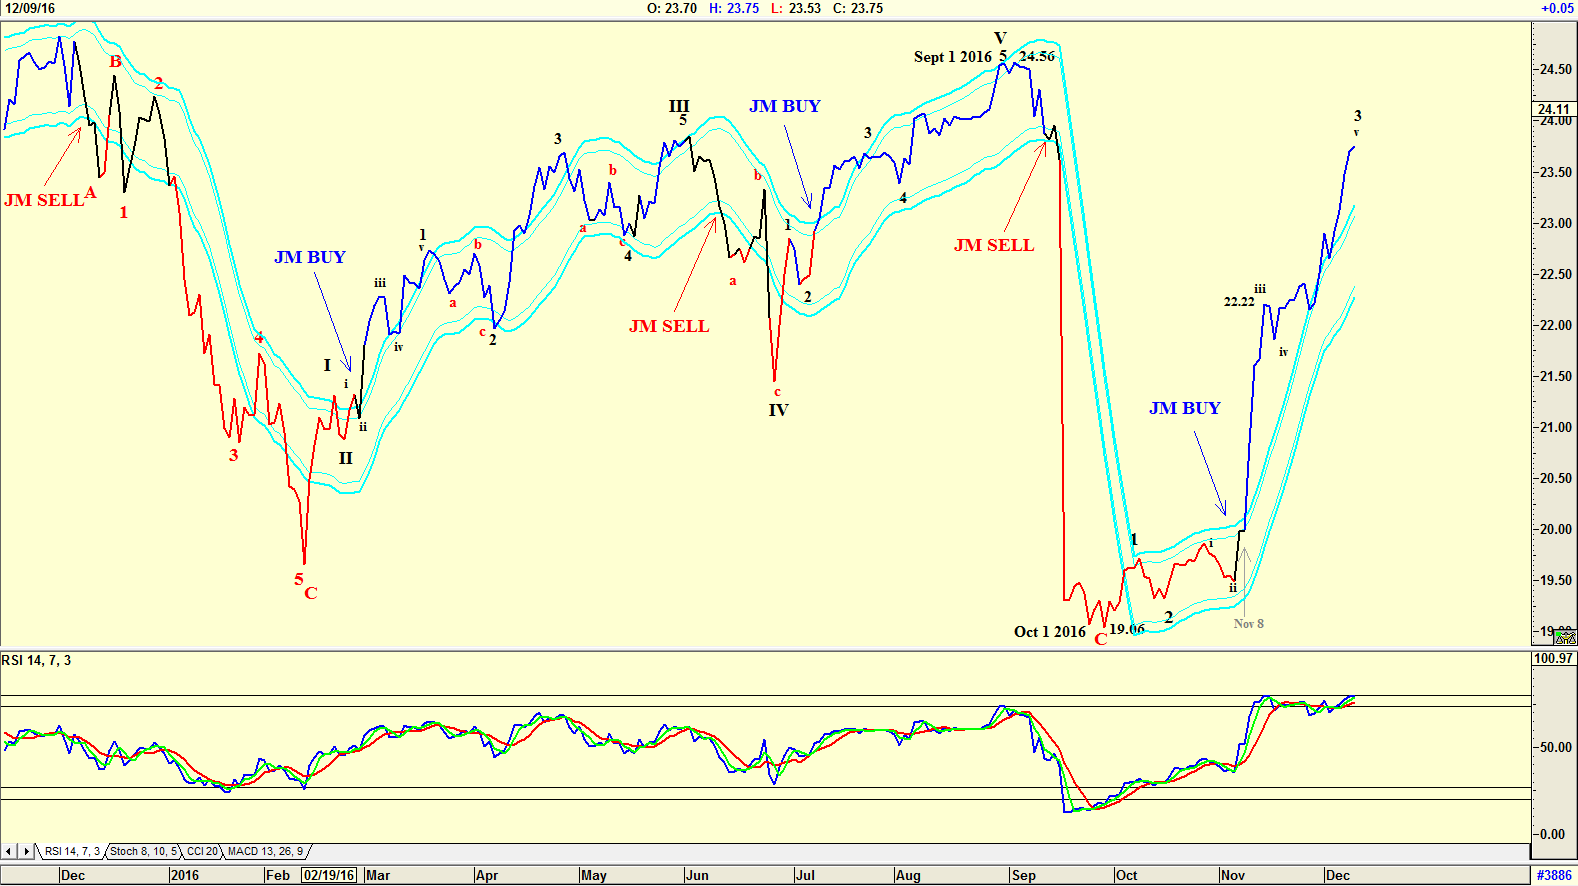
| Figure 1. Daily chart with Elliott wave count. |
| Graphic provided by: AdvancedGET. |
| |
| The chart in Figure 1 is a daily chart of the Amex Financial Select Sector showing how the market rose to $24.56 by September 1st 2016 and then collapsed to $19.06 by October 1st. The Index has since risen, and strongly, from November 9th, when the results of the election were known. The chart shows that the RSI is presently at overbought levels, waiting for a sell signal to be confirmed. The ETF appears to be completing a wave 3 suggesting that it should correct in a wave 4. Wave 2 was a simple correction, which means that wave 4 should be a complicated correction, correcting as low as $22.22, the 4th wave of lesser degree. The JM Internal Band indicator is still in buy mode. The JM Internal Band is a simple 15 period moving average offset by 2% positive and 2% negative. A move above the upper band suggests a buy and below the lower band a sell. |

|
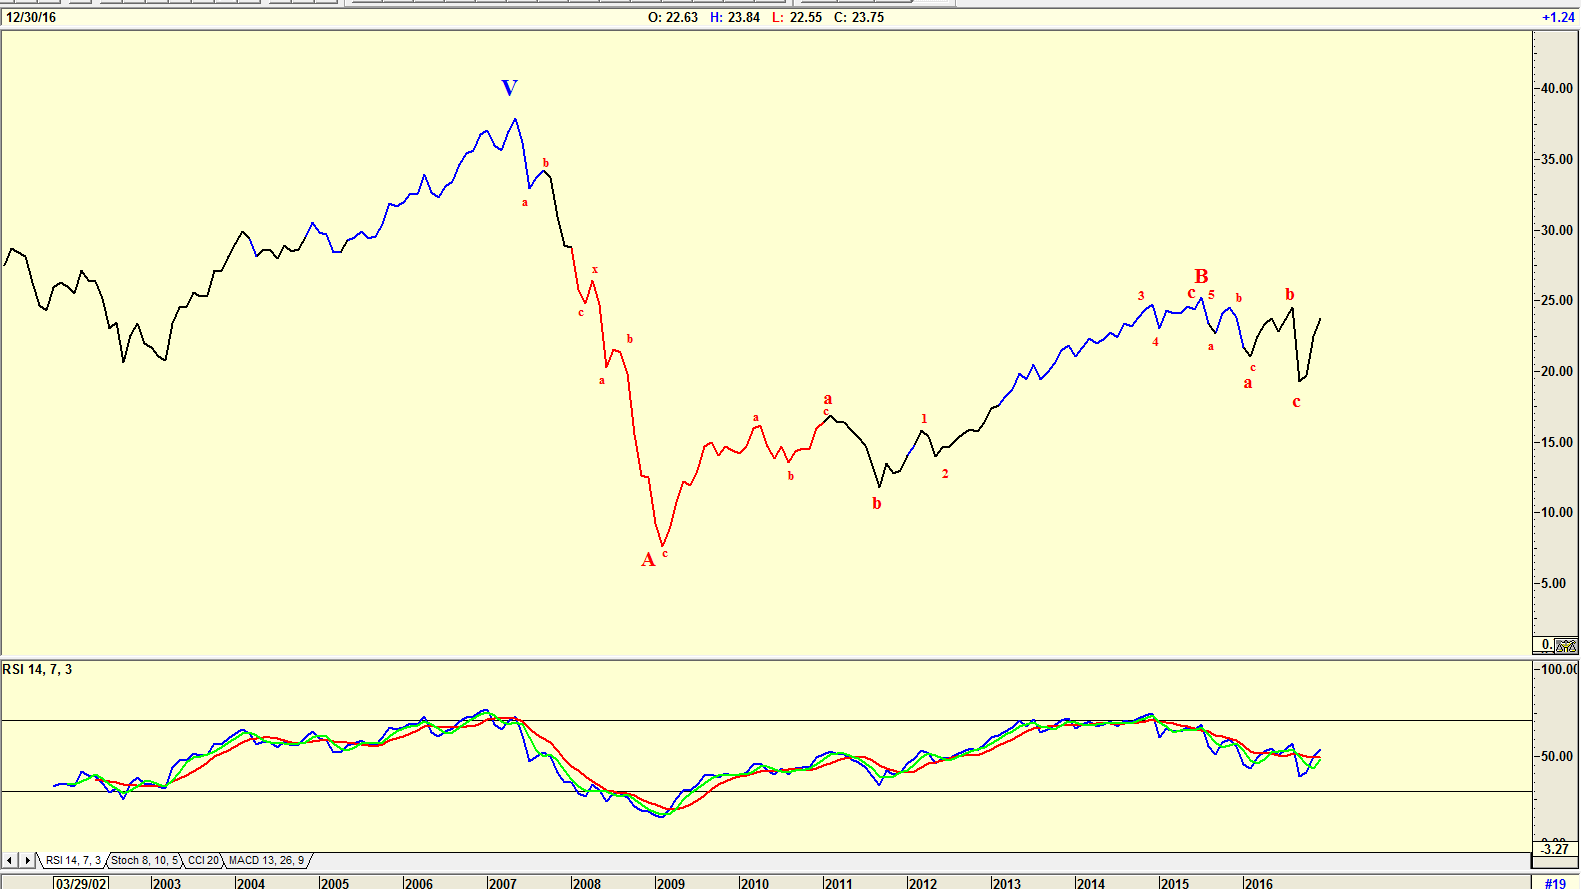
| Figure 2. Monthly chart with Elliott wave analysis. |
| Graphic provided by: AdvancedGET. |
| |
| The chart in Figure 2 is a monthly chart with an Elliott wave count suggesting the ETF is presently in a WAVE C down. The RSI indicator is also suggesting weakness. The elected President, Donald Trump, has shown that whatever he said or promised in the election campaign, is not necessarily something he will do. Like the shrewd and clever businessman that he is, he will listen to and follow the best advice given by those appointed to his cabinet to the benefit of America. However, bubbles do tend to burst, so one should follow charts and careful technical analysis to forecast the future and not bet all one's cards on Trumponomics. |
Has been a technical analyst since 1969, and has worked as a futures and options trader with First Financial Futures in Johannesburg, South Africa.
| Address: | 3256 West 24th Ave |
| Vancouver, BC | |
| Phone # for sales: | 6042634214 |
| E-mail address: | petroosp@gmail.com |
Click here for more information about our publications!
Comments
Date: 01/14/17Rank: 1Comment: Living proof that Elliot waves are a tad more fictional than a crystal ball...This article , whilst i respect the writers views , demonstrates how one can read tea leaves and make them fit any ideas that come to mind.

Request Information From Our Sponsors
- StockCharts.com, Inc.
- Candle Patterns
- Candlestick Charting Explained
- Intermarket Technical Analysis
- John Murphy on Chart Analysis
- John Murphy's Chart Pattern Recognition
- John Murphy's Market Message
- MurphyExplainsMarketAnalysis-Intermarket Analysis
- MurphyExplainsMarketAnalysis-Visual Analysis
- StockCharts.com
- Technical Analysis of the Financial Markets
- The Visual Investor
- VectorVest, Inc.
- Executive Premier Workshop
- One-Day Options Course
- OptionsPro
- Retirement Income Workshop
- Sure-Fire Trading Systems (VectorVest, Inc.)
- Trading as a Business Workshop
- VectorVest 7 EOD
- VectorVest 7 RealTime/IntraDay
- VectorVest AutoTester
- VectorVest Educational Services
- VectorVest OnLine
- VectorVest Options Analyzer
- VectorVest ProGraphics v6.0
- VectorVest ProTrader 7
- VectorVest RealTime Derby Tool
- VectorVest Simulator
- VectorVest Variator
- VectorVest Watchdog
