HOT TOPICS LIST
- MACD
- Fibonacci
- RSI
- Gann
- ADXR
- Stochastics
- Volume
- Triangles
- Futures
- Cycles
- Volatility
- ZIGZAG
- MESA
- Retracement
- Aroon
INDICATORS LIST
LIST OF TOPICS
PRINT THIS ARTICLE
by Koos van der Merwe
Howard Schultz will step down as Starbucks Chief next year.
Position: Accumulate
Koos van der Merwe
Has been a technical analyst since 1969, and has worked as a futures and options trader with First Financial Futures in Johannesburg, South Africa.
PRINT THIS ARTICLE
TECHNICAL ANALYSIS
Should One Sell Starbucks Now?
12/07/16 10:15:51 AMby Koos van der Merwe
Howard Schultz will step down as Starbucks Chief next year.
Position: Accumulate
| In 1987, Howard Schultz purchased Starbucks from its original owners, and began to expand the company. With its initial public offering on the stock market in 1992, Starbucks had 140 outlets. By September 1992, the share price had risen by 70% to over 100 times the earnings per share of previous years. In the year 2000, Howard Schultz stepped down as President, handing over control to Orin C. Smith. Sales slowed down in the company over the following eight years, and Howard Schultz resumed his roles as President and CEO, restoring the "distinctive Starbucks experience" with rapid expansion. Now with the announcement on December 1st, 2016 that he will resign as CEO of Starbucks, effective April 2017, and become executive chairman, will the share price of the company start falling again? |

|
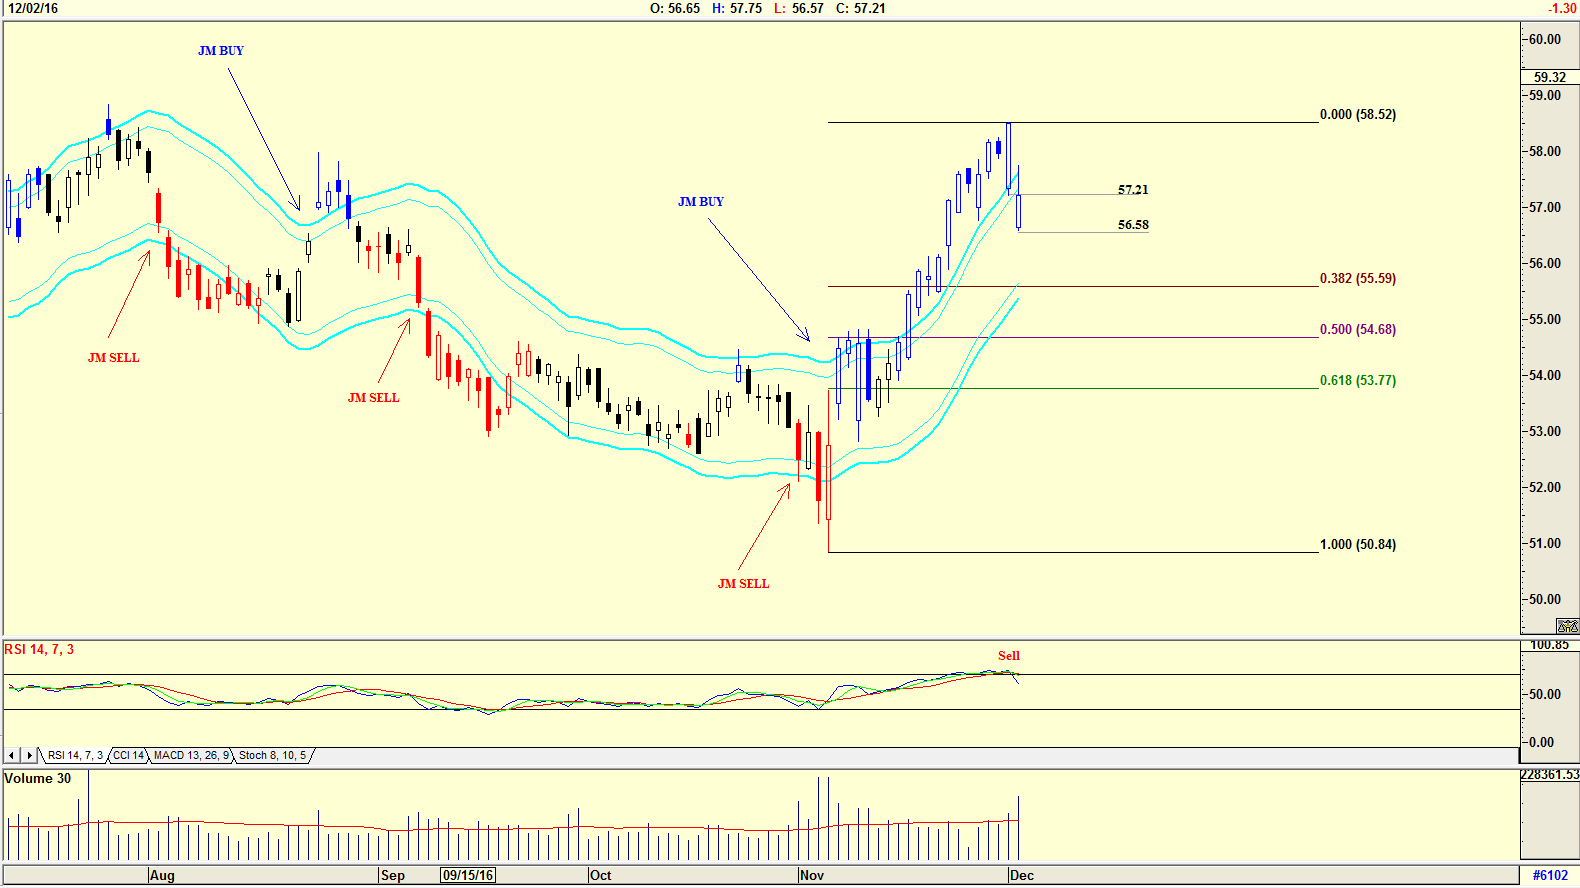
| Figure 1. Daily chart of Starbucks. |
| Graphic provided by: AdvancedGET. |
| |
| The chart in Figure 1 is a daily chart showing how the share price dropped from $58.52 to $57.21 after his announcement, and continued falling to $56.58 on December 2nd, closing at $57.21, the closing price of December 1st. A Fibonacci retracement suggests that the price could fall to $55.59 (38.2% retracement), $54.68 (50% retracement) or $53.77 (61.8% retracement). Of course, the share price could well fall further, depending on how the new CEO manages the company, but taking a leaf out of Apple, where after the death of Steve Jobs, under the new CEO Tim Cooke, the share price has increased in value, the same could occur with Starbucks. However, looking at the chart, the RSI indicator has given a sell, so we could expect more downside. Note that the share is still in buy mode with the JM Internal Band. The JM Internal Band is a 15 period simple moving average offset by 2% plus and 2% negative. A move above the upper band suggests a buy and below the lower band a sell. |

|
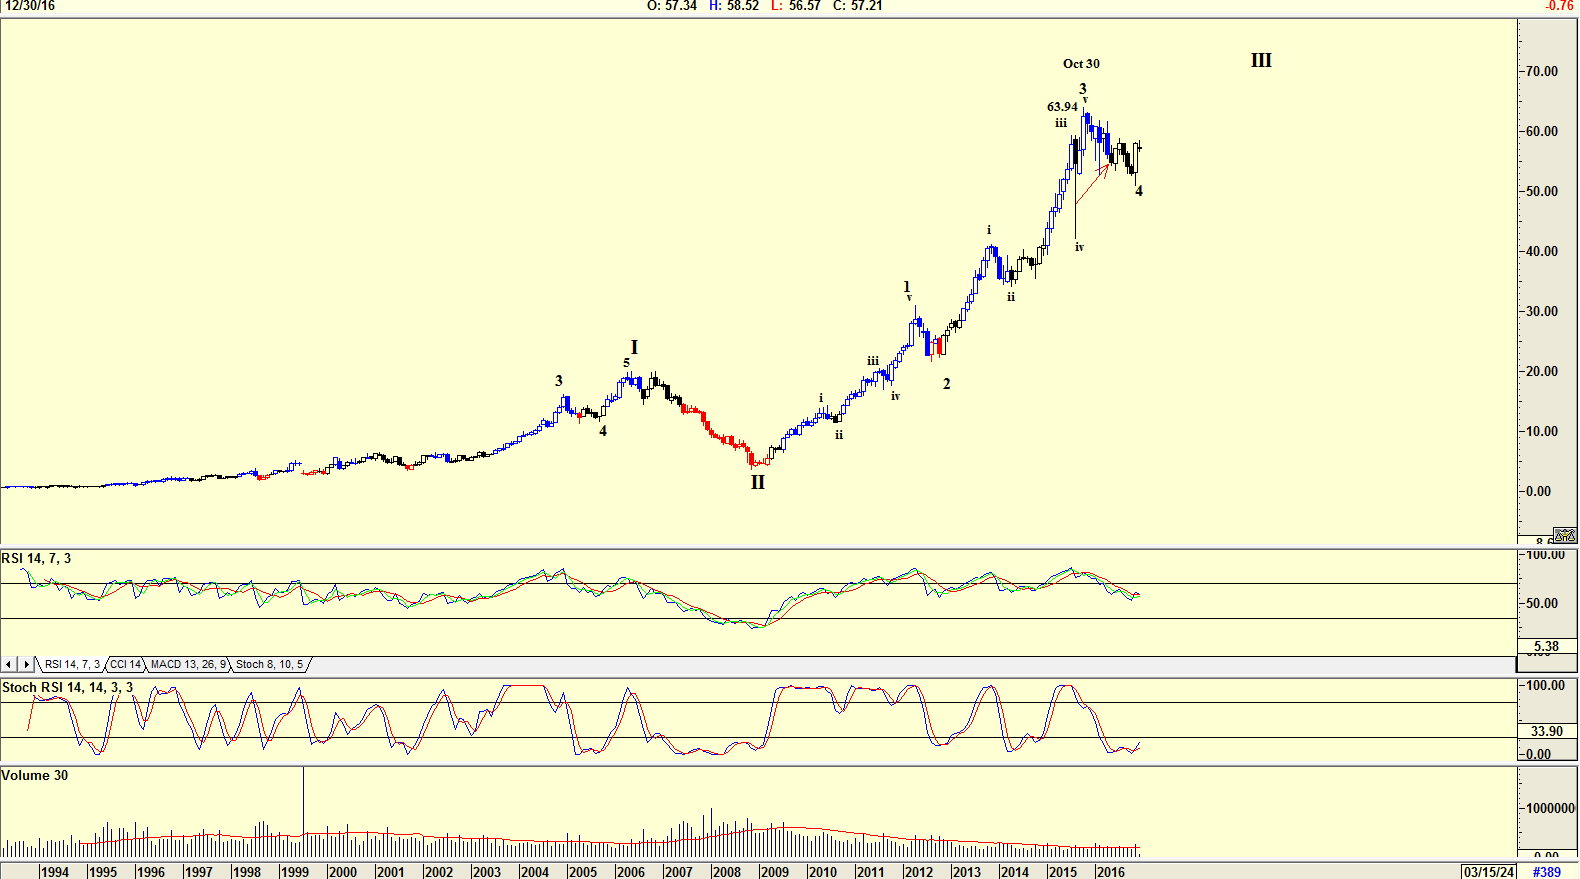
| Figure 2. Monthly chart of Starbucks. |
| Graphic provided by: AdvancedGET. |
| |
| The chart in Figure 2 is a monthly chart with an Elliott wave count suggesting that the share price is tracing a Wave 4 of WAVE III. The RSI indicator is suggesting weakness, but the Stochastic RSI is suggesting strength. With the announcement by Howard Schultz of the change in management of the company, investors ran for cover, selling the share, but this could present a buying opportunity for long term shareholders. New management of the company could present new ideas, and further growth. This is a company that should be watched. |
Has been a technical analyst since 1969, and has worked as a futures and options trader with First Financial Futures in Johannesburg, South Africa.
| Address: | 3256 West 24th Ave |
| Vancouver, BC | |
| Phone # for sales: | 6042634214 |
| E-mail address: | petroosp@gmail.com |
Click here for more information about our publications!
PRINT THIS ARTICLE

Request Information From Our Sponsors
- StockCharts.com, Inc.
- Candle Patterns
- Candlestick Charting Explained
- Intermarket Technical Analysis
- John Murphy on Chart Analysis
- John Murphy's Chart Pattern Recognition
- John Murphy's Market Message
- MurphyExplainsMarketAnalysis-Intermarket Analysis
- MurphyExplainsMarketAnalysis-Visual Analysis
- StockCharts.com
- Technical Analysis of the Financial Markets
- The Visual Investor
- VectorVest, Inc.
- Executive Premier Workshop
- One-Day Options Course
- OptionsPro
- Retirement Income Workshop
- Sure-Fire Trading Systems (VectorVest, Inc.)
- Trading as a Business Workshop
- VectorVest 7 EOD
- VectorVest 7 RealTime/IntraDay
- VectorVest AutoTester
- VectorVest Educational Services
- VectorVest OnLine
- VectorVest Options Analyzer
- VectorVest ProGraphics v6.0
- VectorVest ProTrader 7
- VectorVest RealTime Derby Tool
- VectorVest Simulator
- VectorVest Variator
- VectorVest Watchdog
