HOT TOPICS LIST
- MACD
- Fibonacci
- RSI
- Gann
- ADXR
- Stochastics
- Volume
- Triangles
- Futures
- Cycles
- Volatility
- ZIGZAG
- MESA
- Retracement
- Aroon
INDICATORS LIST
LIST OF TOPICS
PRINT THIS ARTICLE
by Koos van der Merwe
When a stock triggers a buy signal on the charts, it is a stock to keep an eye on.
Position: Accumulate
Koos van der Merwe
Has been a technical analyst since 1969, and has worked as a futures and options trader with First Financial Futures in Johannesburg, South Africa.
PRINT THIS ARTICLE
TECHNICAL INDICATORS
American Electric - A Stock To Watch
11/30/16 04:28:10 PMby Koos van der Merwe
When a stock triggers a buy signal on the charts, it is a stock to keep an eye on.
Position: Accumulate
| American Electric Power is a major electric utility in the USA, delivering electricity to more than 5 million customers in 11 states. The company ranks among the nation's largest generators of electricity, also owning the nation's largest electricity transmission system. The company has, however, come under heavy criticism in many states for attacking rooftop solar systems. The company has recently agreed to sell its merchant power plants in Ohio and Indiana for $2.2 billion in its effort to become a pure-play regulated utility company. It is also presently forecasting earnings growth of 4%-6% annually for the next few years. The company is also expected to spend approximately $15 billion on capital projects through 2018. |

|
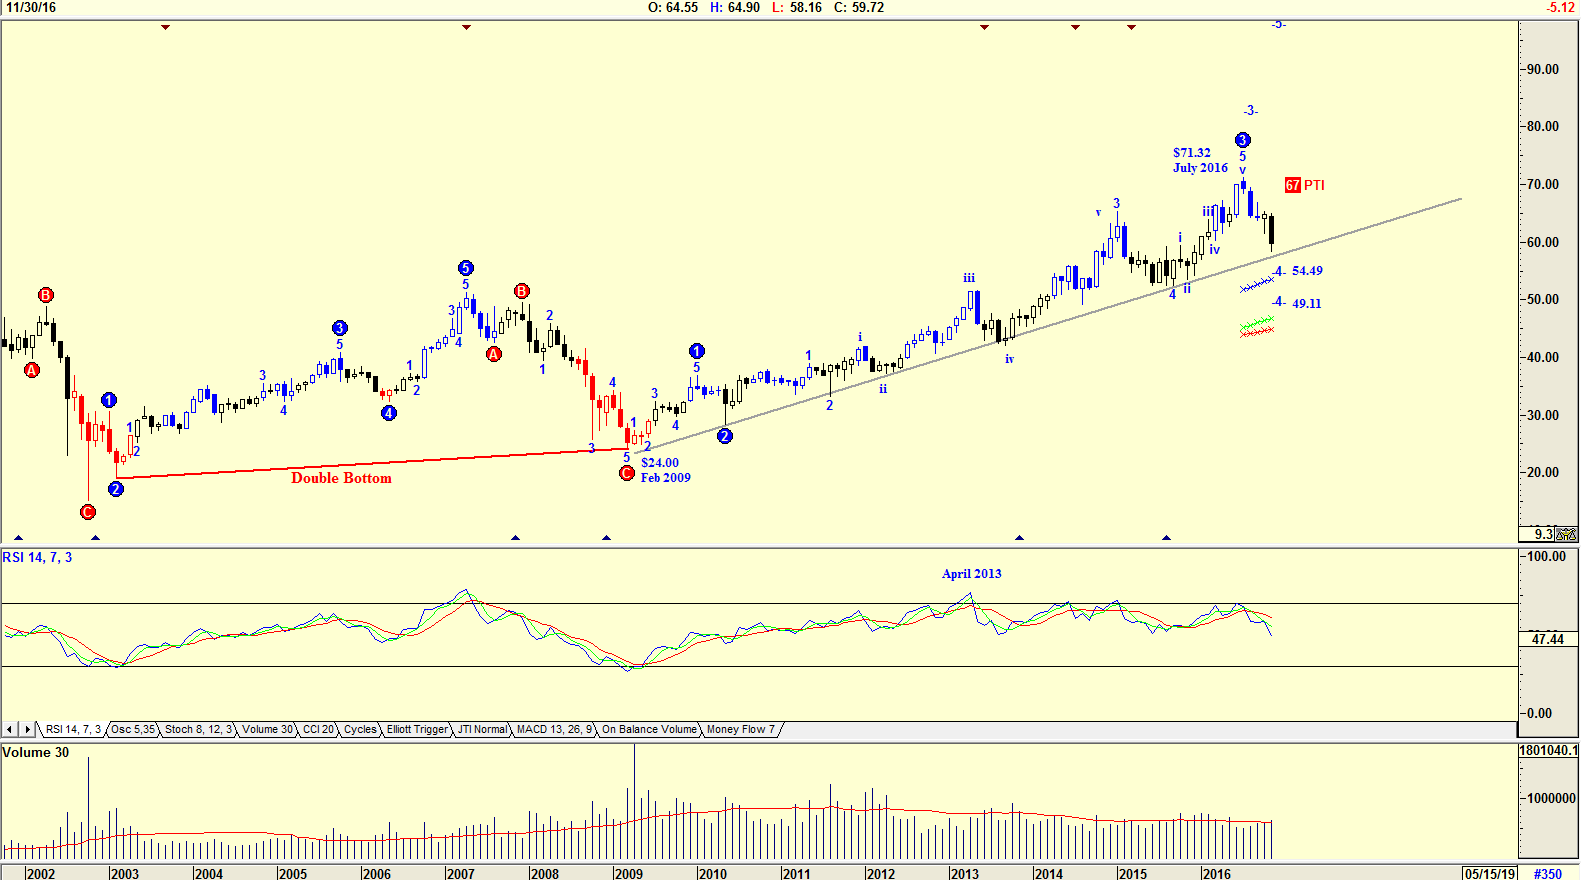
| Figure 1. Monthly chart with Elliott wave count. |
| Graphic provided by: AdvancedGET. |
| |
| The chart in Figure 1 is a monthly Advanced GET chart showing how the share price rose from a low of $24.00 in February 2009 to a high of $71.32 by July 2016. The RSI indicator gave a buy signal on February 2009 and rose to over-bought levels by April 2013 suggesting a sell signal. The indicator remained at overbought levels as the share price bounced off its supporting trend line as it rose higher in an Elliott Wave 3. At the moment it is suggesting a correction in a Wave 4 to either $54.49 or $49.11. The PTI (probability Index) is at 67% which is high. Do note the double bottom formed on the chart. |

|
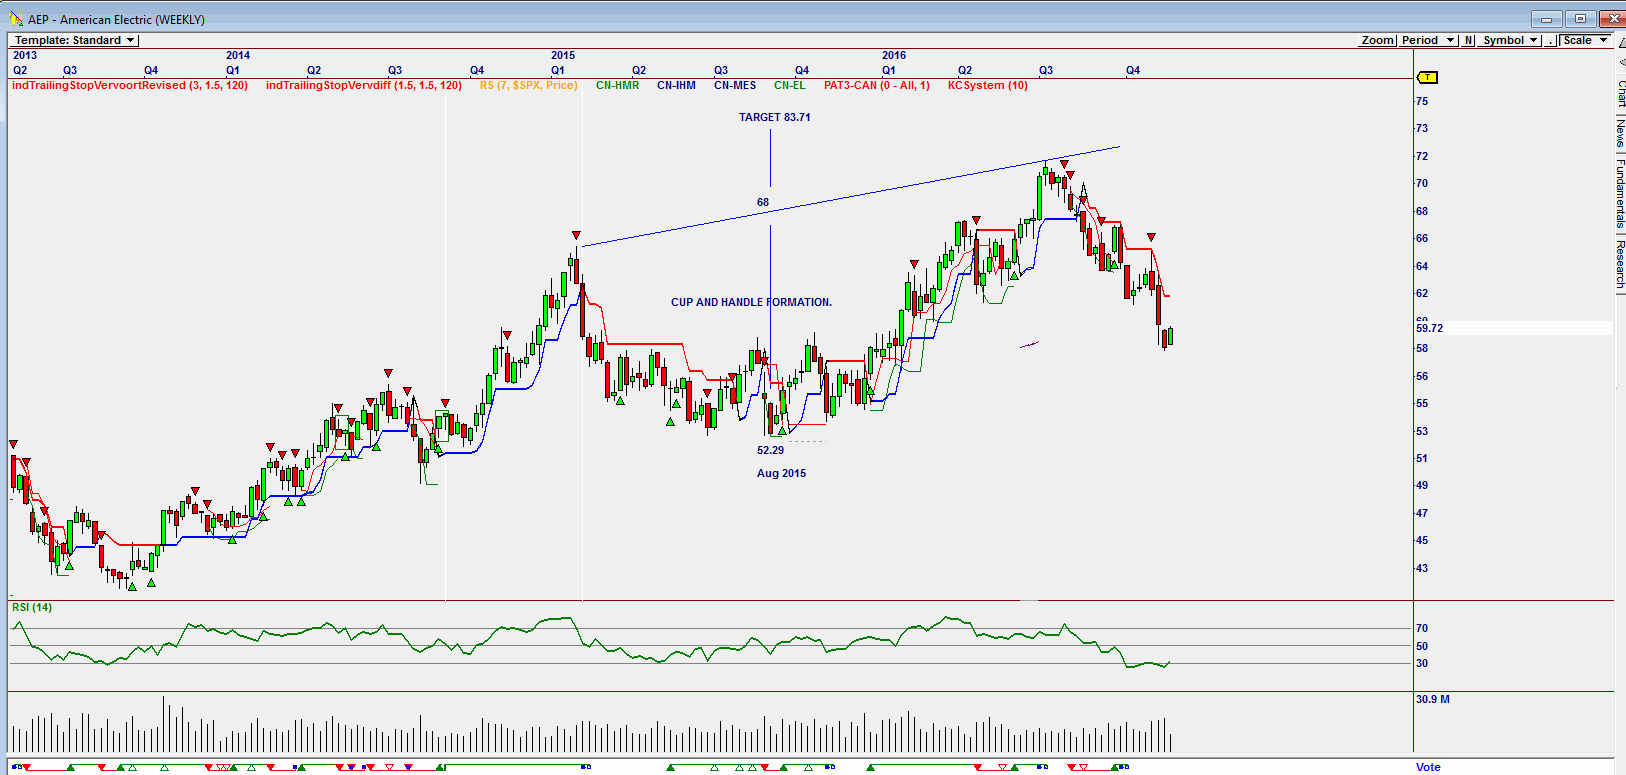
| Figure 2. Weekly Omnitrader chart showing cup and handle formation. |
| Graphic provided by: Omnitrader. |
| |
| The chart in Figure 2 is an Omnitrader weekly chart showing how a cup and handle formation has formed, suggesting a target of $83.71. The RSI indicator is at oversold levels, but has, as yet, not triggered a buy signal as shown on the Vote line. Looking at the volume, one can see that volume fell as the share price rose during the week of November 25th, suggesting further weakness. |

|
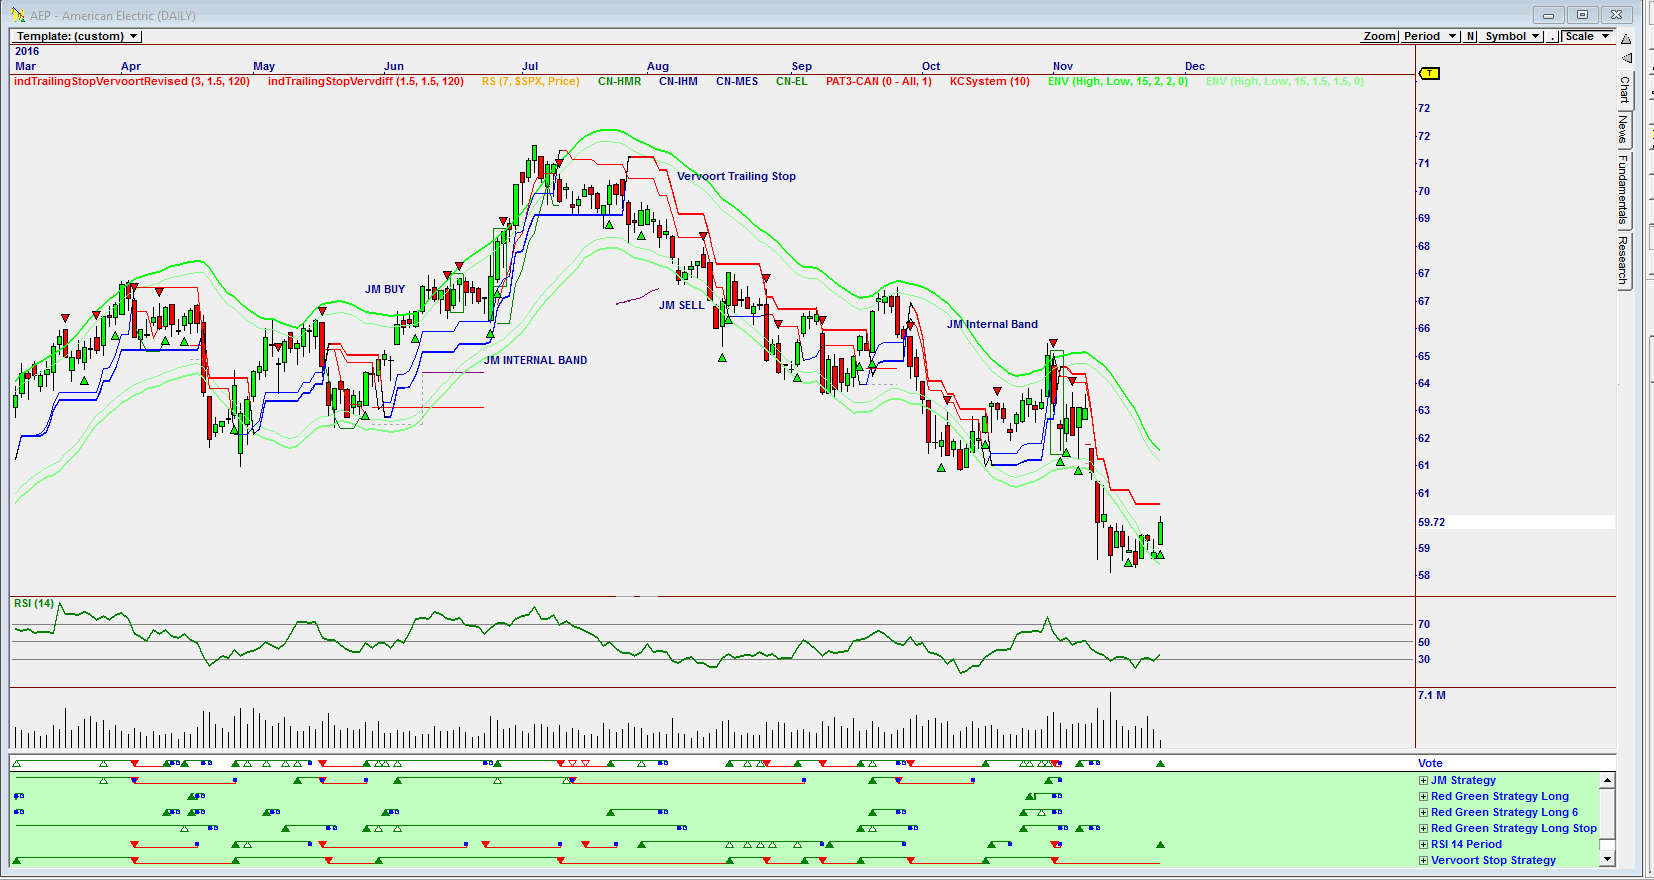
| Figure 3. Daily Omnitrader chart showing buy signal. |
| Graphic provided by: Omnitrader. |
| |
| The Daily chart in Figure 3 has suggested a buy signal shown on the Vote line, triggered by the RSI 14-period strategy shown in green below the Vote line. Do note that the price rarely broke above the JM Internal Band upper line. Traders could purchase the share based on the buy signal triggered on the Vote line in the daily Omnitrader chart of Figure 3. Investors could wait for the share price to move above the upper JM Internal Band. However, looking at the fundamentals of the company, and with the share price currently trading at a dividend yield of 3.6%, it is an attractive buy at the present price for a long term hold. |
Has been a technical analyst since 1969, and has worked as a futures and options trader with First Financial Futures in Johannesburg, South Africa.
| Address: | 3256 West 24th Ave |
| Vancouver, BC | |
| Phone # for sales: | 6042634214 |
| E-mail address: | petroosp@gmail.com |
Click here for more information about our publications!
PRINT THIS ARTICLE

|

Request Information From Our Sponsors
- StockCharts.com, Inc.
- Candle Patterns
- Candlestick Charting Explained
- Intermarket Technical Analysis
- John Murphy on Chart Analysis
- John Murphy's Chart Pattern Recognition
- John Murphy's Market Message
- MurphyExplainsMarketAnalysis-Intermarket Analysis
- MurphyExplainsMarketAnalysis-Visual Analysis
- StockCharts.com
- Technical Analysis of the Financial Markets
- The Visual Investor
- VectorVest, Inc.
- Executive Premier Workshop
- One-Day Options Course
- OptionsPro
- Retirement Income Workshop
- Sure-Fire Trading Systems (VectorVest, Inc.)
- Trading as a Business Workshop
- VectorVest 7 EOD
- VectorVest 7 RealTime/IntraDay
- VectorVest AutoTester
- VectorVest Educational Services
- VectorVest OnLine
- VectorVest Options Analyzer
- VectorVest ProGraphics v6.0
- VectorVest ProTrader 7
- VectorVest RealTime Derby Tool
- VectorVest Simulator
- VectorVest Variator
- VectorVest Watchdog
